
- Start >
- Rivers >
- Discharge >
- Isar >
- Bad Feilnbach >
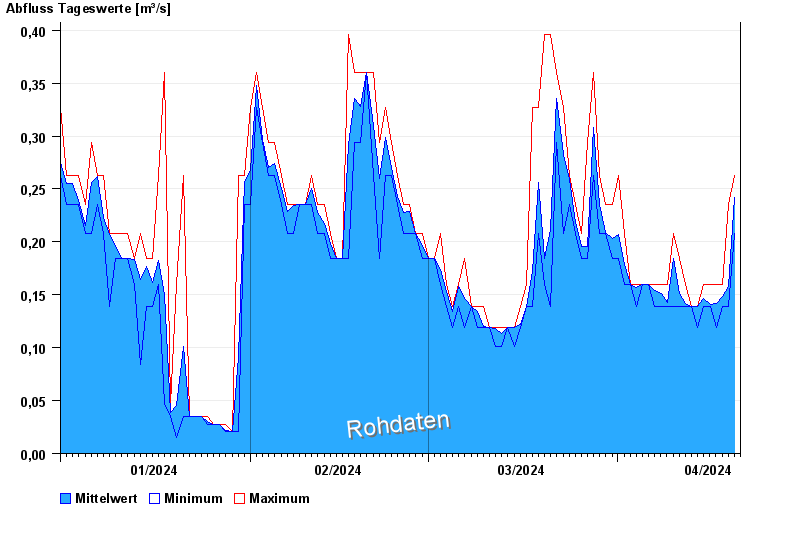
- Chart of year

Chart of year Bad Feilnbach / Mühlbach
Discharge from 01.01.2024 to 20.04.2024
- 24.12.1999 Abfluss: 1,56 m³/s
- 14.06.2000 Abfluss: 1,23 m³/s
- 04.09.1999 Abfluss: 1,22 m³/s
- 01.01.2006 Abfluss: 1,16 m³/s
- 06.08.2002 Abfluss: 0,91 m³/s
| Date | Mean value [m³/s] | Maximum [m³/s] | Minimum [m³/s] |
|---|---|---|---|
| 20.04.2024 | 0.237 | 0.263 | 0.235 |
| 19.04.2024 | 0.158 | 0.235 | 0.139 |
| 18.04.2024 | 0.148 | 0.16 | 0.139 |
| 17.04.2024 | 0.142 | 0.16 | 0.119 |
| 16.04.2024 | 0.141 | 0.16 | 0.139 |
| 15.04.2024 | 0.146 | 0.16 | 0.139 |
| 14.04.2024 | 0.139 | 0.139 | 0.119 |
© Bayerisches Landesamt für Umwelt 2024