

Chart of year Achsheim / Schmutter
Discharge from 05.08.2022 to 04.08.2023
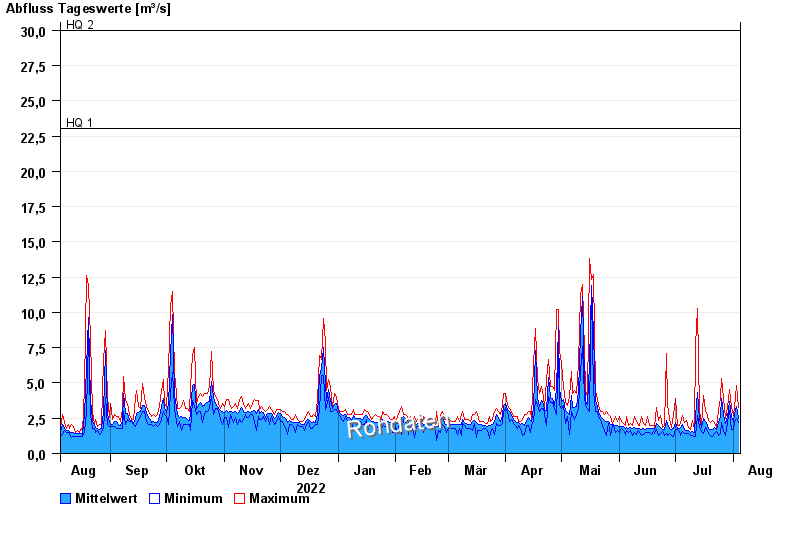
- HQ1 23 m³/s
- HQ2 30 m³/s
- HQ5 43 m³/s
- HQ10 53 m³/s
- HQ20 62 m³/s
- HQ50 77 m³/s
- HQ100 88 m³/s
| Date | Mean value [m³/s] | Maximum [m³/s] | Minimum [m³/s] |
|---|---|---|---|
| 04.08.2023 | 2.5 | 3.25 | 2.17 |
| 03.08.2023 | 3.32 | 4.82 | 2.51 |
| 02.08.2023 | 2.78 | 3.25 | 2.17 |
| 01.08.2023 | 2.24 | 2.68 | 1.7 |
| 31.07.2023 | 2.55 | 3.25 | 1.7 |
| 30.07.2023 | 3.7 | 4.57 | 3.06 |
| 29.07.2023 | 2.64 | 3.25 | 2.17 |
© Bayerisches Landesamt für Umwelt 2024