

Chart of year Achsheim / Schmutter
Discharge from 05.08.2021 to 04.08.2022
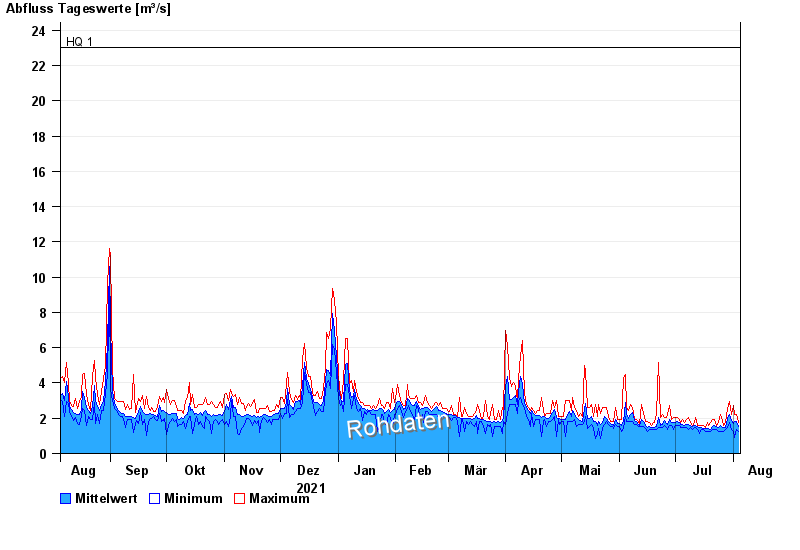
- HQ1 23 m³/s
- HQ2 30 m³/s
- HQ5 43 m³/s
- HQ10 53 m³/s
- HQ20 62 m³/s
- HQ50 77 m³/s
- HQ100 88 m³/s
| Date | Mean value [m³/s] | Maximum [m³/s] | Minimum [m³/s] |
|---|---|---|---|
| 04.08.2022 | 1.54 | 1.76 | 1.23 |
| 03.08.2022 | 1.82 | 2.22 | 1.35 |
| 02.08.2022 | 1.82 | 2.22 | 0.894 |
| 01.08.2022 | 1.71 | 2.74 | 1.23 |
| 31.07.2022 | 1.85 | 2.22 | 1.35 |
| 30.07.2022 | 2.21 | 2.93 | 1.76 |
| 29.07.2022 | 1.96 | 2.56 | 1.48 |
© Bayerisches Landesamt für Umwelt 2024