

Chart of year Weg / Isen
Discharge from 17.09.2020 to 16.09.2021
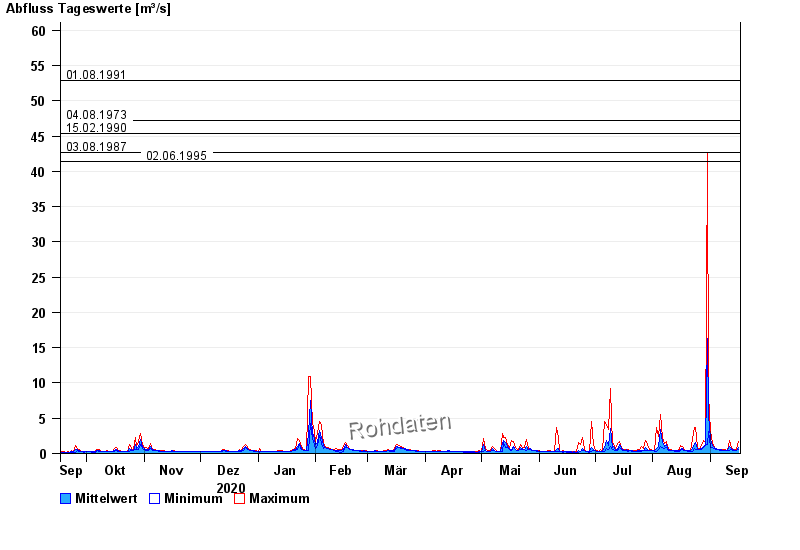
- 01.08.1991 Abfluss: 52,8 m³/s
- 04.08.1973 Abfluss: 47,2 m³/s
- 15.02.1990 Abfluss: 45,3 m³/s
- 03.08.1987 Abfluss: 42,6 m³/s
- 02.06.1995 Abfluss: 41,4 m³/s
| Date | Mean value [m³/s] | Maximum [m³/s] | Minimum [m³/s] |
|---|---|---|---|
| 16.09.2021 | 0.821 | 1.64 | 0.538 |
| 15.09.2021 | 0.464 | 0.565 | 0.442 |
| 14.09.2021 | 0.481 | 0.565 | 0.442 |
| 13.09.2021 | 0.521 | 0.565 | 0.466 |
| 12.09.2021 | 0.678 | 0.912 | 0.565 |
| 11.09.2021 | 1 | 1.83 | 0.42 |
| 10.09.2021 | 0.445 | 0.466 | 0.42 |
© Bayerisches Landesamt für Umwelt 2024