

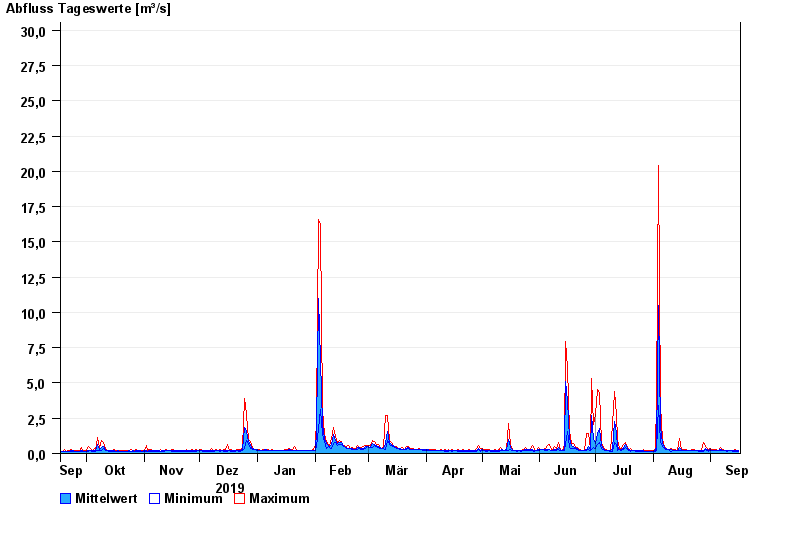
Chart of year Weg / Isen
Discharge from 17.09.2019 to 16.09.2020
- 01.08.1991 Abfluss: 52,8 m³/s
- 04.08.1973 Abfluss: 47,2 m³/s
- 15.02.1990 Abfluss: 45,3 m³/s
- 03.08.1987 Abfluss: 42,6 m³/s
- 02.06.1995 Abfluss: 41,4 m³/s
| Date | Mean value [m³/s] | Maximum [m³/s] | Minimum [m³/s] |
|---|---|---|---|
| 16.09.2020 | 0.187 | 0.205 | 0.172 |
| 15.09.2020 | 0.189 | 0.212 | 0.159 |
| 14.09.2020 | 0.192 | 0.257 | 0.159 |
| 13.09.2020 | 0.195 | 0.222 | 0.175 |
| 12.09.2020 | 0.207 | 0.226 | 0.19 |
| 11.09.2020 | 0.206 | 0.226 | 0.181 |
| 10.09.2020 | 0.207 | 0.223 | 0.171 |
© Bayerisches Landesamt für Umwelt 2024