

Chart of year Triftern / Altbach
Discharge from 01.01.2023 to 31.12.2023
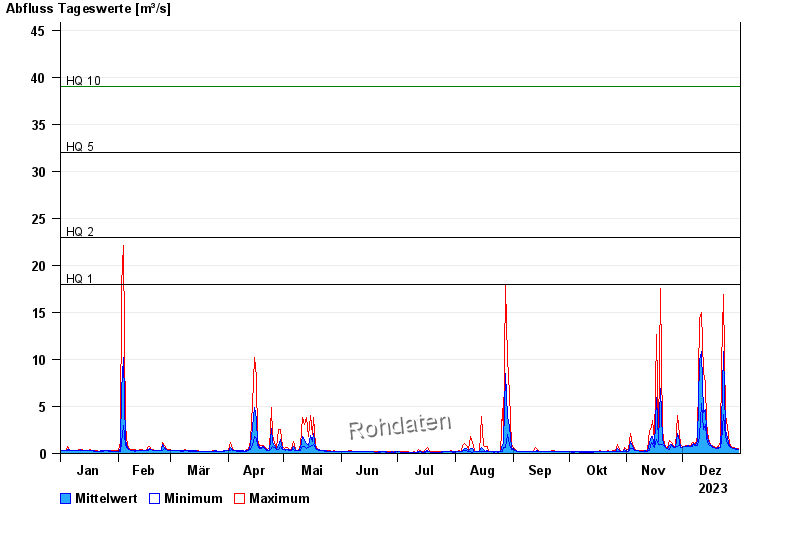
- HQ1 18 m³/s
- HQ2 23 m³/s
- HQ5 32 m³/s
- HQ10 39 m³/s
- HQ20 47 m³/s
- HQ50 60 m³/s
- HQ100 70 m³/s
| Date | Mean value [m³/s] | Maximum [m³/s] | Minimum [m³/s] |
|---|---|---|---|
| 31.12.2023 | 0.457 | 0.546 | 0.448 |
| 30.12.2023 | 0.496 | 0.496 | 0.448 |
| 29.12.2023 | 0.535 | 0.599 | 0.496 |
| 28.12.2023 | 0.577 | 0.652 | 0.546 |
| 27.12.2023 | 0.678 | 0.766 | 0.599 |
| 26.12.2023 | 0.895 | 1.06 | 0.766 |
| 25.12.2023 | 1.62 | 2.86 | 1.06 |
© Bayerisches Landesamt für Umwelt 2024