

Chart of year Triftern / Altbach
Discharge from 01.01.2022 to 31.12.2022
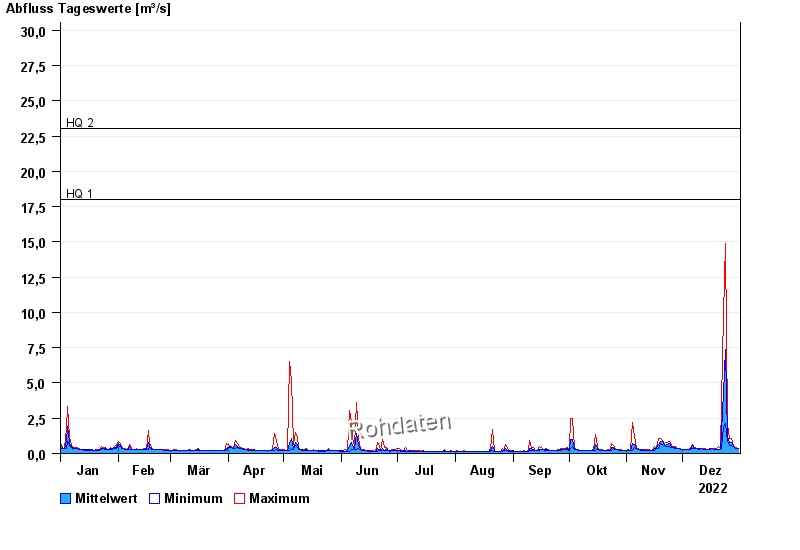
- HQ1 18 m³/s
- HQ2 23 m³/s
- HQ5 32 m³/s
- HQ10 39 m³/s
- HQ20 47 m³/s
- HQ50 60 m³/s
- HQ100 70 m³/s
| Date | Mean value [m³/s] | Maximum [m³/s] | Minimum [m³/s] |
|---|---|---|---|
| 31.12.2022 | 0.357 | 0.357 | 0.357 |
| 30.12.2022 | 0.369 | 0.392 | 0.357 |
| 29.12.2022 | 0.425 | 0.469 | 0.392 |
| 28.12.2022 | 0.499 | 0.595 | 0.469 |
| 27.12.2022 | 0.753 | 1.07 | 0.595 |
| 26.12.2022 | 0.747 | 1.07 | 0.595 |
| 25.12.2022 | 1.22 | 2.03 | 0.846 |
© Bayerisches Landesamt für Umwelt 2024