

Chart of year Simbach / Simbach
Discharge from 17.05.2021 to 16.05.2022
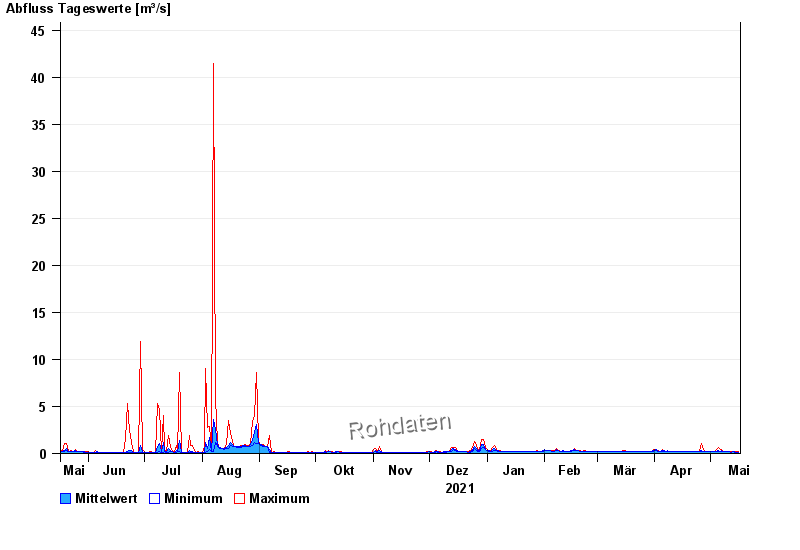
| Date | Mean value [m³/s] | Maximum [m³/s] | Minimum [m³/s] |
|---|---|---|---|
| 16.05.2022 | 0.154 | 0.16 | 0.139 |
| 15.05.2022 | 0.157 | 0.16 | 0.139 |
| 14.05.2022 | 0.16 | 0.16 | 0.139 |
| 13.05.2022 | 0.192 | 0.233 | 0.182 |
| 12.05.2022 | 0.158 | 0.206 | 0.139 |
| 11.05.2022 | 0.16 | 0.16 | 0.16 |
| 10.05.2022 | 0.164 | 0.182 | 0.16 |
© Bayerisches Landesamt für Umwelt 2024