

Chart of year Simbach / Simbach
Discharge from 17.05.2022 to 16.05.2023
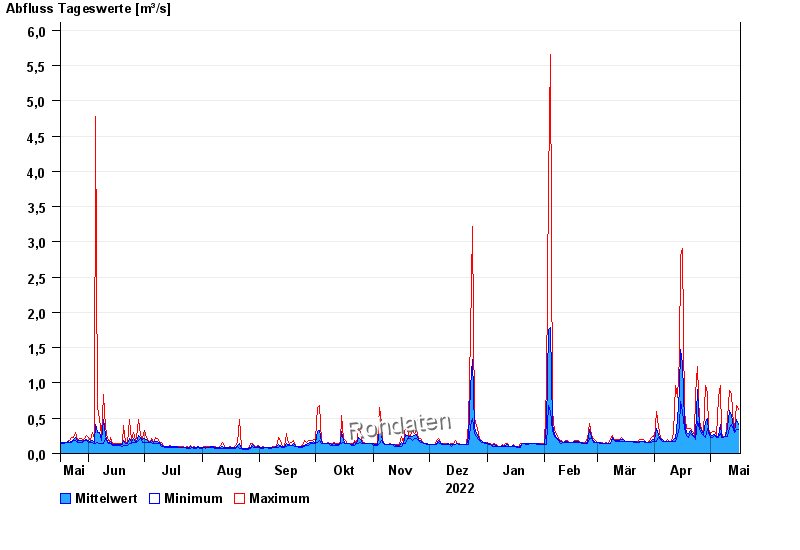
| Date | Mean value [m³/s] | Maximum [m³/s] | Minimum [m³/s] |
|---|---|---|---|
| 16.05.2023 | 0.416 | 0.63 | 0.337 |
| 15.05.2023 | 0.486 | 0.68 | 0.337 |
| 14.05.2023 | 0.32 | 0.337 | 0.303 |
| 13.05.2023 | 0.362 | 0.411 | 0.337 |
| 12.05.2023 | 0.543 | 0.841 | 0.411 |
| 11.05.2023 | 0.616 | 0.9 | 0.373 |
| 10.05.2023 | 0.368 | 0.492 | 0.242 |
© Bayerisches Landesamt für Umwelt 2024