
- Start >
- Rivers >
- Discharge >
- Inn >
- Schneizlreuth Weißbach >
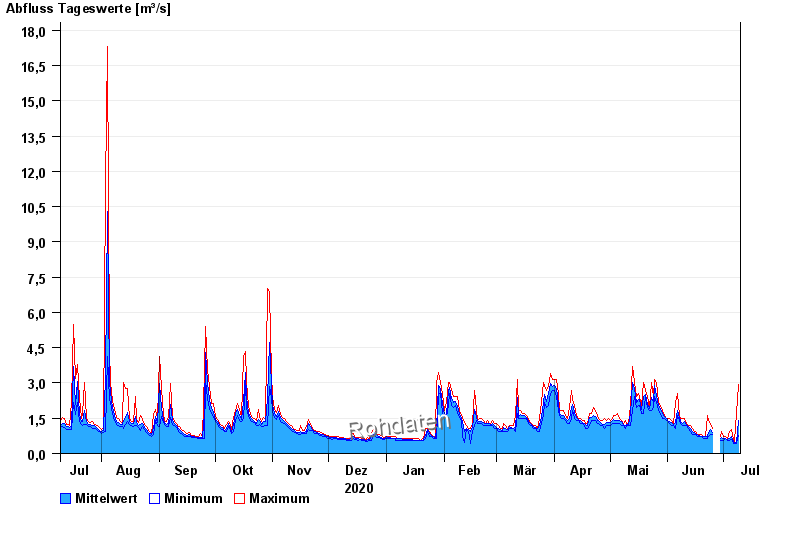
- Chart of year

Chart of year Schneizlreuth Weißbach / Weißbach
Discharge from 10.07.2020 to 09.07.2021
| Date | Mean value [m³/s] | Maximum [m³/s] | Minimum [m³/s] |
|---|---|---|---|
| 09.07.2021 | 1.4 | 2.92 | 0.783 |
| 08.07.2021 | 0.48 | 1.69 | 0.421 |
| 07.07.2021 | 0.465 | 0.498 | 0.421 |
| 06.07.2021 | 0.517 | 0.586 | 0.421 |
| 05.07.2021 | 0.74 | 1.01 | 0.586 |
| 04.07.2021 | 0.636 | 0.94 | 0.562 |
| 03.07.2021 | 0.614 | 0.646 | 0.562 |
© Bayerisches Landesamt für Umwelt 2024