
- Start >
- Rivers >
- Discharge >
- Inn >
- Schneizlreuth Weißbach >
- Chart of year

Chart of year Schneizlreuth Weißbach / Weißbach
Discharge from 01.01.2019 to 31.12.2019
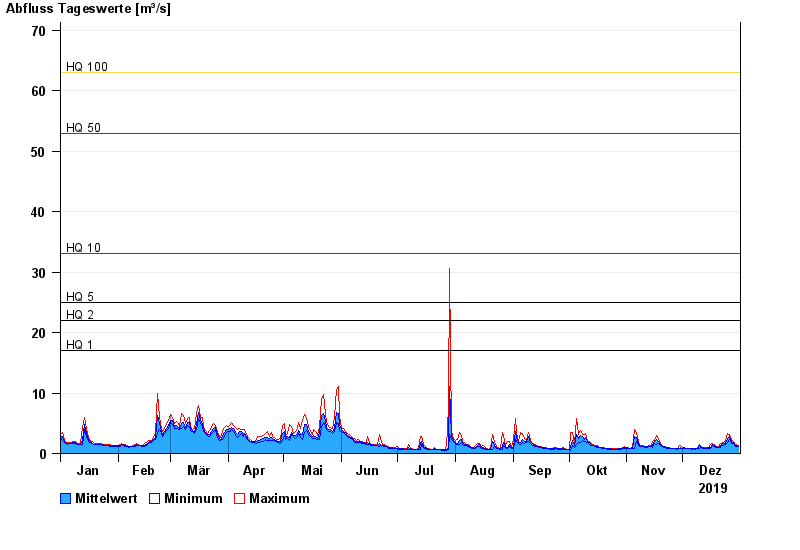
- HQ1 17 m³/s
- HQ2 22 m³/s
- HQ5 25 m³/s
- HQ10 33 m³/s
- HQ50 53 m³/s
- HQ100 63 m³/s
| Date | Mean value [m³/s] | Maximum [m³/s] | Minimum [m³/s] |
|---|---|---|---|
| 31.12.2019 | 1.22 | 1.33 | 1.12 |
| 30.12.2019 | 1.28 | 1.43 | 1.15 |
| 29.12.2019 | 1.51 | 1.66 | 1.34 |
| 28.12.2019 | 1.8 | 1.91 | 1.64 |
| 27.12.2019 | 1.91 | 2.3 | 1.71 |
| 26.12.2019 | 2.77 | 3.1 | 2.27 |
| 25.12.2019 | 2.56 | 3.27 | 1.75 |
© Bayerisches Landesamt für Umwelt 2024