
- Start >
- Rivers >
- Discharge >
- Inn >
- Schneizlreuth Weißbach >
- Chart of year

Chart of year Schneizlreuth Weißbach / Weißbach
Discharge from 26.07.2021 to 25.07.2022
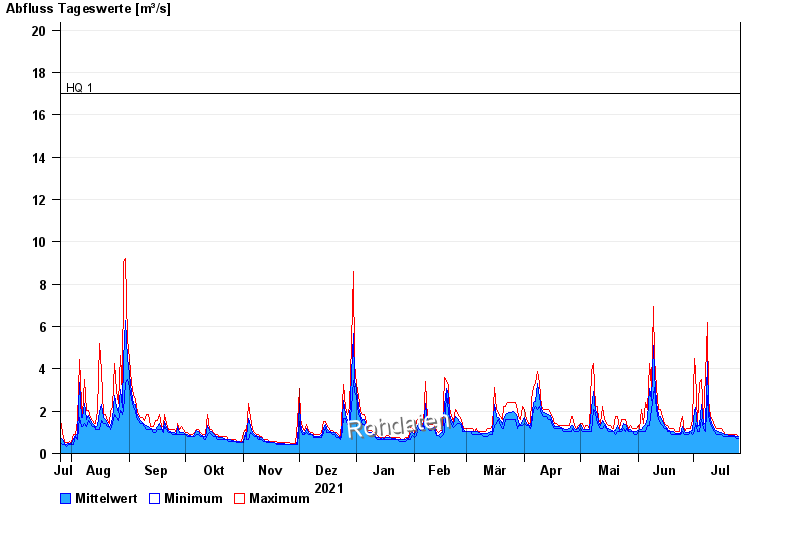
- HQ1 17 m³/s
- HQ2 22 m³/s
- HQ5 25 m³/s
- HQ10 33 m³/s
- HQ50 53 m³/s
- HQ100 63 m³/s
| Date | Mean value [m³/s] | Maximum [m³/s] | Minimum [m³/s] |
|---|---|---|---|
| 25.07.2022 | 0.808 | 0.812 | 0.711 |
| 24.07.2022 | 0.813 | 0.921 | 0.711 |
| 23.07.2022 | 0.834 | 0.921 | 0.812 |
| 22.07.2022 | 0.847 | 0.921 | 0.812 |
| 21.07.2022 | 0.868 | 0.921 | 0.812 |
| 20.07.2022 | 0.869 | 0.921 | 0.812 |
| 19.07.2022 | 0.887 | 0.921 | 0.812 |
© Bayerisches Landesamt für Umwelt 2024