
- Start >
- Rivers >
- Discharge >
- Inn >
- Schneizlreuth Weißbach >
- Chart of year

Chart of year Schneizlreuth Weißbach / Weißbach
Discharge from 01.01.2021 to 31.12.2021
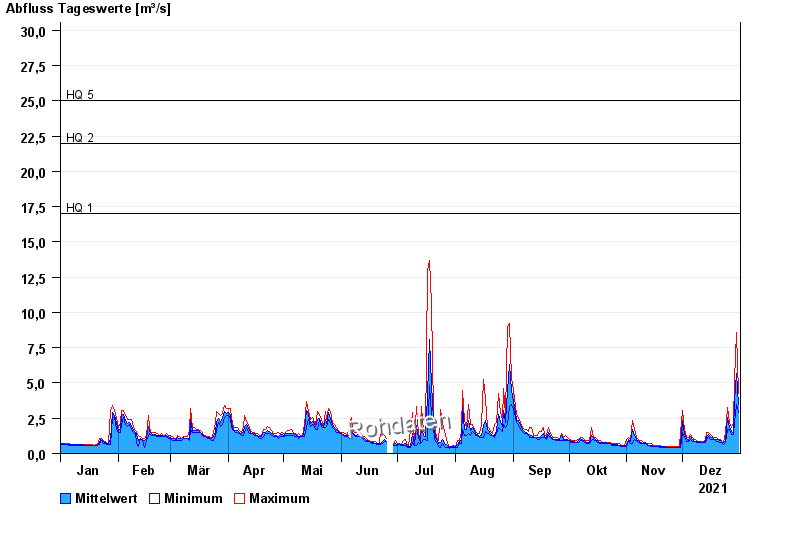
- HQ1 17 m³/s
- HQ2 22 m³/s
- HQ5 25 m³/s
- HQ10 33 m³/s
- HQ50 53 m³/s
- HQ100 63 m³/s
| Date | Mean value [m³/s] | Maximum [m³/s] | Minimum [m³/s] |
|---|---|---|---|
| 31.12.2021 | 3.44 | 4.23 | 2.9 |
| 30.12.2021 | 5.66 | 8.59 | 3.46 |
| 29.12.2021 | 3.73 | 5.19 | 2.17 |
| 28.12.2021 | 1.48 | 2.17 | 1.38 |
| 27.12.2021 | 1.57 | 1.84 | 1.38 |
| 26.12.2021 | 1.82 | 2.17 | 1.67 |
| 25.12.2021 | 2.52 | 3.28 | 1.67 |
© Bayerisches Landesamt für Umwelt 2024