
- Start >
- Rivers >
- Discharge >
- Inn >
- Schneizlreuth Weißbach >
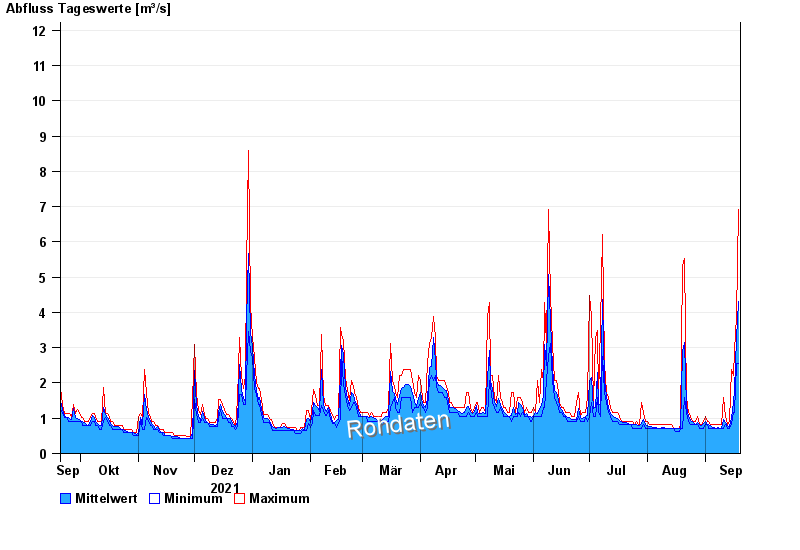
- Chart of year

Chart of year Schneizlreuth Weißbach / Weißbach
Discharge from 20.09.2021 to 19.09.2022
- 02.06.2013 Abfluss: 60,1 m³/s
- 26.06.1995 Abfluss: 55,7 m³/s
- 01.08.1977 Abfluss: 52 m³/s
- 07.08.1985 Abfluss: 47,2 m³/s
- 11.07.2005 Abfluss: 46,8 m³/s
| Date | Mean value [m³/s] | Maximum [m³/s] | Minimum [m³/s] |
|---|---|---|---|
| 19.09.2022 | 4.3 | 6.93 | 2.56 |
| 18.09.2022 | 3.25 | 3.87 | 2.56 |
| 17.09.2022 | 1.8 | 2.93 | 1.16 |
| 16.09.2022 | 1.48 | 2.22 | 1.16 |
| 15.09.2022 | 1 | 2.39 | 0.812 |
| 14.09.2022 | 0.769 | 0.921 | 0.711 |
| 13.09.2022 | 0.784 | 0.812 | 0.711 |
© Bayerisches Landesamt für Umwelt 2024