

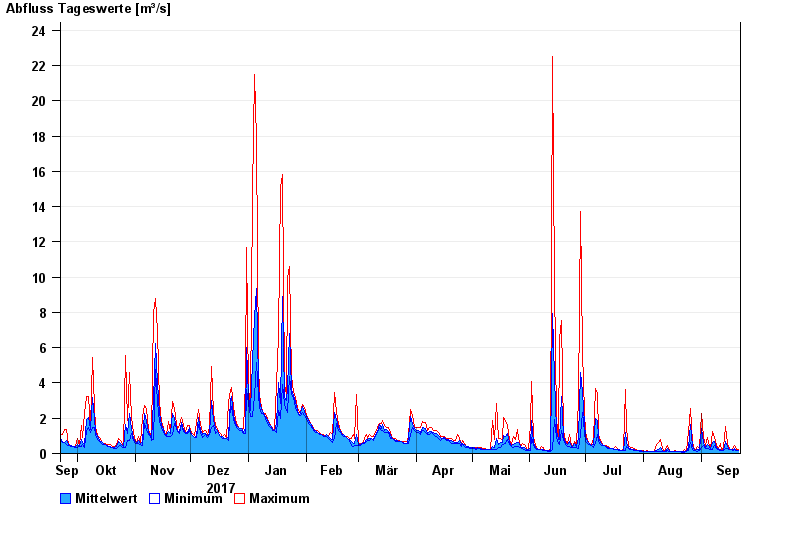
Chart of year Piding / Stoißer Ache
Discharge from 22.09.2017 to 21.09.2018
| Date | Mean value [m³/s] | Maximum [m³/s] | Minimum [m³/s] |
|---|---|---|---|
| 21.09.2018 | 0.171 | 0.201 | 0.168 |
| 20.09.2018 | 0.191 | 0.201 | 0.168 |
| 19.09.2018 | 0.306 | 0.473 | 0.2 |
| 18.09.2018 | 0.202 | 0.339 | 0.168 |
| 17.09.2018 | 0.2 | 0.2 | 0.199 |
| 16.09.2018 | 0.25 | 0.284 | 0.199 |
| 15.09.2018 | 0.372 | 0.547 | 0.284 |
© Bayerisches Landesamt für Umwelt 2024