

Chart of year Piding / Stoißer Ache
Discharge from 22.09.2018 to 21.09.2019
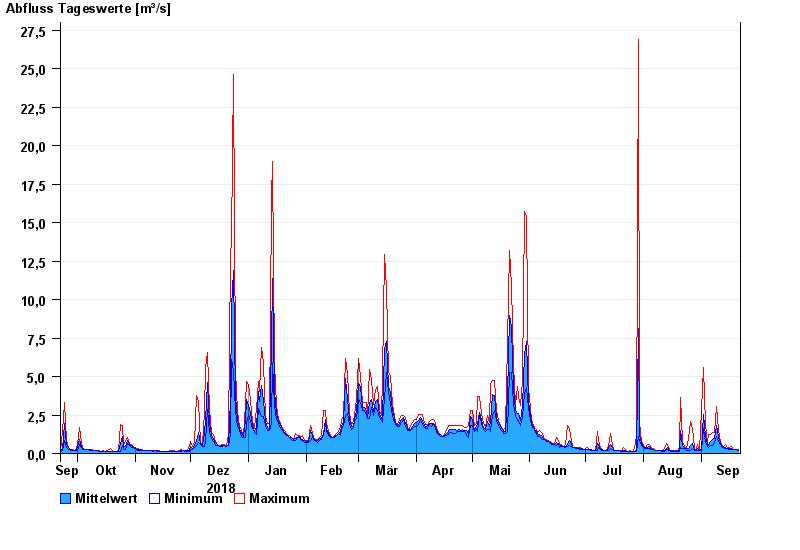
| Date | Mean value [m³/s] | Maximum [m³/s] | Minimum [m³/s] |
|---|---|---|---|
| 21.09.2019 | 0.212 | 0.231 | 0.193 |
| 20.09.2019 | 0.231 | 0.231 | 0.231 |
| 19.09.2019 | 0.232 | 0.275 | 0.23 |
| 18.09.2019 | 0.261 | 0.275 | 0.23 |
| 17.09.2019 | 0.338 | 0.456 | 0.274 |
| 16.09.2019 | 0.314 | 0.388 | 0.23 |
| 15.09.2019 | 0.326 | 0.326 | 0.326 |
© Bayerisches Landesamt für Umwelt 2024