

Chart of year Piding / Stoißer Ache
Discharge from 01.01.2024 to 26.04.2024
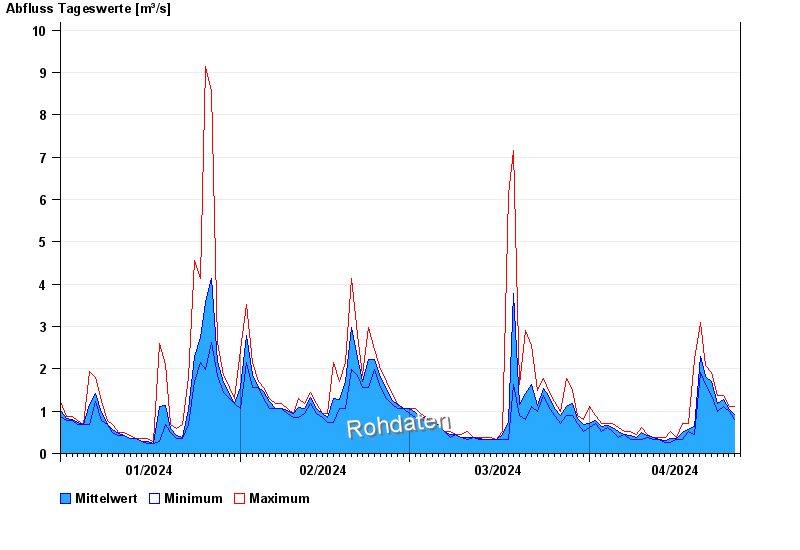
| Date | Mean value [m³/s] | Maximum [m³/s] | Minimum [m³/s] |
|---|---|---|---|
| 26.04.2024 | 0.916 | 1 | 0.894 |
| 25.04.2024 | 1.04 | 1.12 | 1 |
| 24.04.2024 | 1.28 | 1.36 | 1.12 |
| 23.04.2024 | 1.18 | 1.36 | 1 |
| 22.04.2024 | 1.69 | 1.92 | 1.36 |
| 21.04.2024 | 1.82 | 2.07 | 1.63 |
| 20.04.2024 | 2.29 | 3.09 | 1.92 |
© Bayerisches Landesamt für Umwelt 2024