

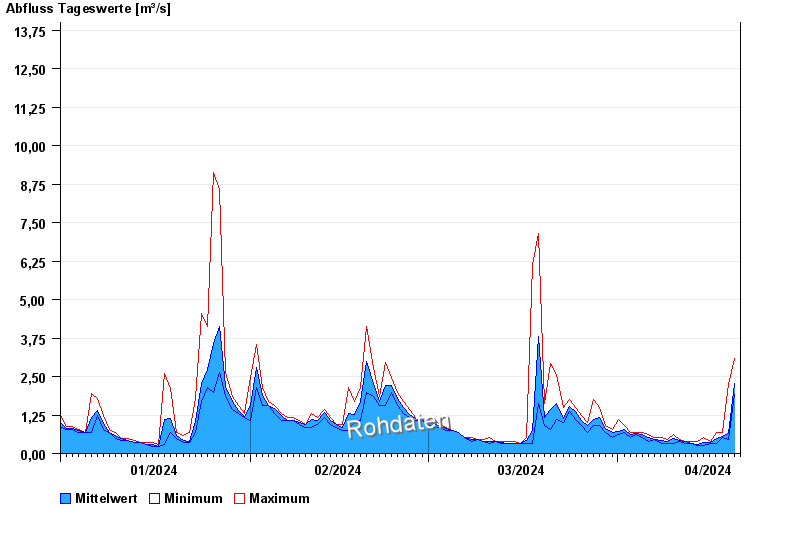
Chart of year Piding / Stoißer Ache
Discharge from 01.01.2024 to 20.04.2024
- 12.08.2002 Abfluss: 103 m³/s
- 08.07.1954 Abfluss: 86 m³/s
- 04.08.2020 Abfluss: 77,7 m³/s
- 26.06.1995 Abfluss: 77,6 m³/s
- 03.07.2009 Abfluss: 72,4 m³/s
| Date | Mean value [m³/s] | Maximum [m³/s] | Minimum [m³/s] |
|---|---|---|---|
| 20.04.2024 | 2.44 | 3.09 | 1.92 |
| 19.04.2024 | 0.648 | 2.23 | 0.449 |
| 18.04.2024 | 0.567 | 0.697 | 0.525 |
| 17.04.2024 | 0.487 | 0.697 | 0.324 |
| 16.04.2024 | 0.362 | 0.384 | 0.324 |
| 15.04.2024 | 0.343 | 0.525 | 0.27 |
| 14.04.2024 | 0.305 | 0.384 | 0.27 |
© Bayerisches Landesamt für Umwelt 2024