

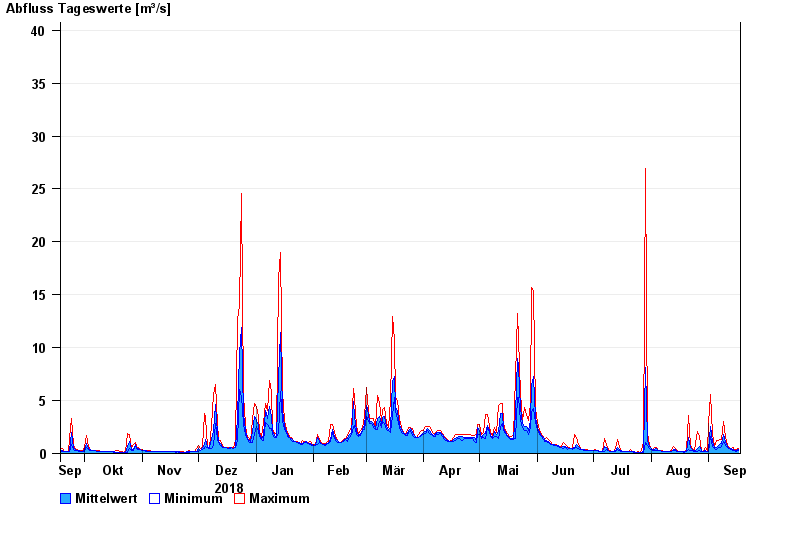
Chart of year Piding / Stoißer Ache
Discharge from 18.09.2018 to 17.09.2019
- 12.08.2002 Abfluss: 103 m³/s
- 08.07.1954 Abfluss: 86 m³/s
- 04.08.2020 Abfluss: 77,7 m³/s
- 26.06.1995 Abfluss: 77,6 m³/s
- 03.07.2009 Abfluss: 72,4 m³/s
| Date | Mean value [m³/s] | Maximum [m³/s] | Minimum [m³/s] |
|---|---|---|---|
| 17.09.2019 | 0.338 | 0.456 | 0.274 |
| 16.09.2019 | 0.314 | 0.388 | 0.23 |
| 15.09.2019 | 0.326 | 0.326 | 0.326 |
| 14.09.2019 | 0.378 | 0.612 | 0.326 |
| 13.09.2019 | 0.427 | 0.455 | 0.386 |
| 12.09.2019 | 0.517 | 0.61 | 0.454 |
| 11.09.2019 | 0.687 | 0.795 | 0.61 |
© Bayerisches Landesamt für Umwelt 2024