

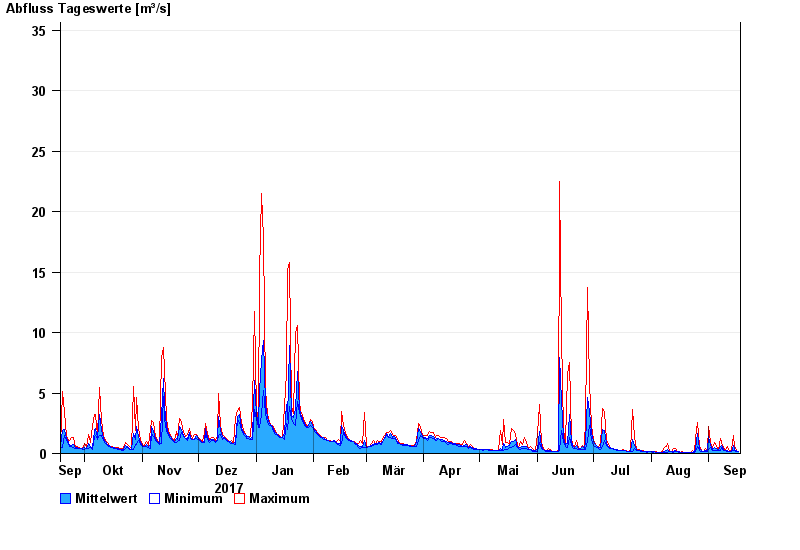
Chart of year Piding / Stoißer Ache
Discharge from 18.09.2017 to 17.09.2018
- 12.08.2002 Abfluss: 103 m³/s
- 08.07.1954 Abfluss: 86 m³/s
- 04.08.2020 Abfluss: 77,7 m³/s
- 26.06.1995 Abfluss: 77,6 m³/s
- 03.07.2009 Abfluss: 72,4 m³/s
| Date | Mean value [m³/s] | Maximum [m³/s] | Minimum [m³/s] |
|---|---|---|---|
| 17.09.2018 | 0.2 | 0.2 | 0.199 |
| 16.09.2018 | 0.25 | 0.284 | 0.199 |
| 15.09.2018 | 0.372 | 0.547 | 0.284 |
| 14.09.2018 | 0.685 | 1.52 | 0.283 |
| 13.09.2018 | 0.185 | 0.337 | 0.166 |
| 12.09.2018 | 0.198 | 0.198 | 0.198 |
| 11.09.2018 | 0.237 | 0.545 | 0.198 |
© Bayerisches Landesamt für Umwelt 2024