

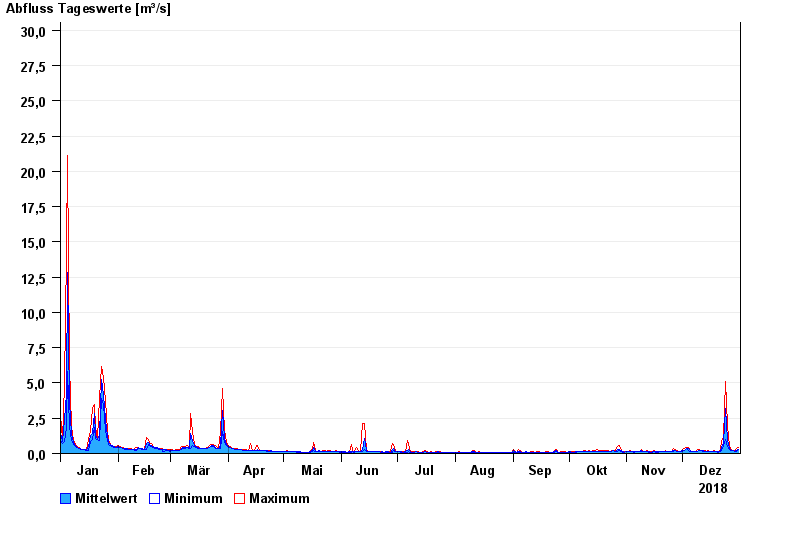
Chart of year Panzing / Bina
Discharge from 01.01.2018 to 31.12.2018
- 02.03.1987 Abfluss: 60,4 m³/s
- 13.01.2011 Abfluss: 53 m³/s
- 01.08.1991 Abfluss: 51,6 m³/s
- 22.02.1970 Abfluss: 49,6 m³/s
- 31.01.1982 Abfluss: 48 m³/s
| Date | Mean value [m³/s] | Maximum [m³/s] | Minimum [m³/s] |
|---|---|---|---|
| 31.12.2018 | 0.309 | 0.41 | 0.254 |
| 30.12.2018 | 0.242 | 0.366 | 0.168 |
| 29.12.2018 | 0.171 | 0.193 | 0.163 |
| 28.12.2018 | 0.207 | 0.225 | 0.193 |
| 27.12.2018 | 0.248 | 0.287 | 0.211 |
| 26.12.2018 | 0.373 | 0.506 | 0.287 |
| 25.12.2018 | 0.959 | 1.95 | 0.506 |
© Bayerisches Landesamt für Umwelt 2024