

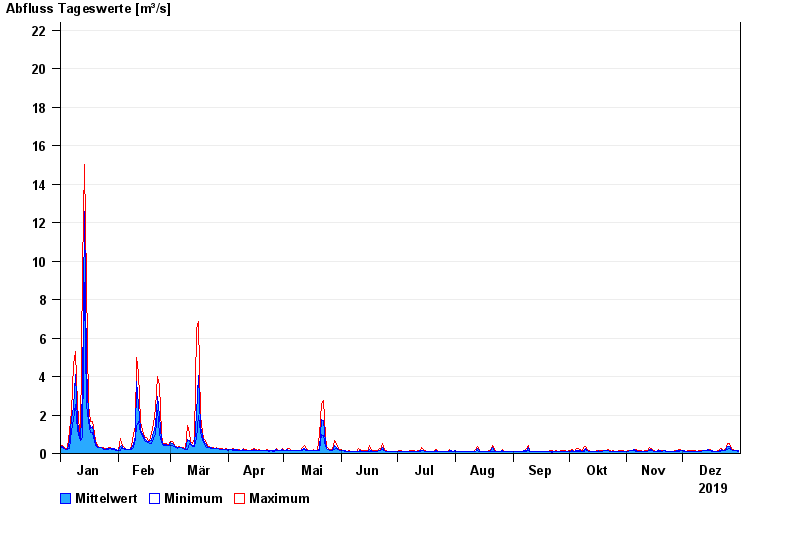
Chart of year Panzing / Bina
Discharge from 01.01.2019 to 31.12.2019
- 02.03.1987 Abfluss: 60,4 m³/s
- 13.01.2011 Abfluss: 53 m³/s
- 01.08.1991 Abfluss: 51,6 m³/s
- 22.02.1970 Abfluss: 49,6 m³/s
- 31.01.1982 Abfluss: 48 m³/s
| Date | Mean value [m³/s] | Maximum [m³/s] | Minimum [m³/s] |
|---|---|---|---|
| 31.12.2019 | 0.141 | 0.141 | 0.12 |
| 30.12.2019 | 0.141 | 0.141 | 0.141 |
| 29.12.2019 | 0.144 | 0.164 | 0.141 |
| 28.12.2019 | 0.167 | 0.189 | 0.163 |
| 27.12.2019 | 0.203 | 0.247 | 0.189 |
| 26.12.2019 | 0.36 | 0.498 | 0.247 |
| 25.12.2019 | 0.355 | 0.522 | 0.216 |
© Bayerisches Landesamt für Umwelt 2024