
- Start >
- Rivers >
- Discharge >
- Inn >
- Langengeisling >
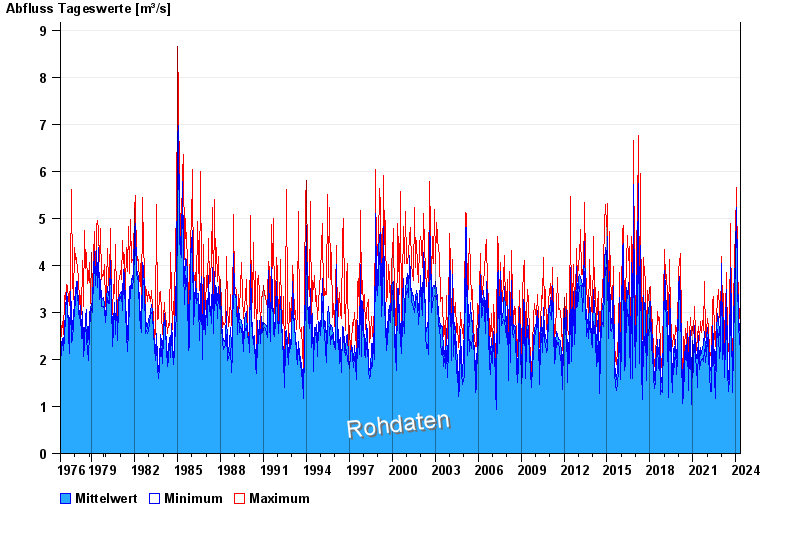
- Chart of total period

Chart of total period Langengeisling / Sempt
Discharge from 01.11.1976 to 28.04.2024
| Date | Mean value [m³/s] | Maximum [m³/s] | Minimum [m³/s] |
|---|---|---|---|
| 28.04.2024 | 1.8 | 1.92 | 1.63 |
| 27.04.2024 | 1.86 | 2.07 | 1.56 |
| 26.04.2024 | 1.97 | 1.99 | 1.85 |
| 25.04.2024 | 2.09 | 2.41 | 1.7 |
| 24.04.2024 | 2.42 | 2.59 | 2.32 |
| 23.04.2024 | 2.5 | 2.78 | 2.32 |
| 22.04.2024 | 2.83 | 3.3 | 2.5 |
© Bayerisches Landesamt für Umwelt 2024