
- Start >
- Rivers >
- Discharge >
- Inn >
- Langengeisling >
- Chart of total period

Chart of total period Langengeisling / Sempt
Discharge from 01.11.1976 to 27.04.2024
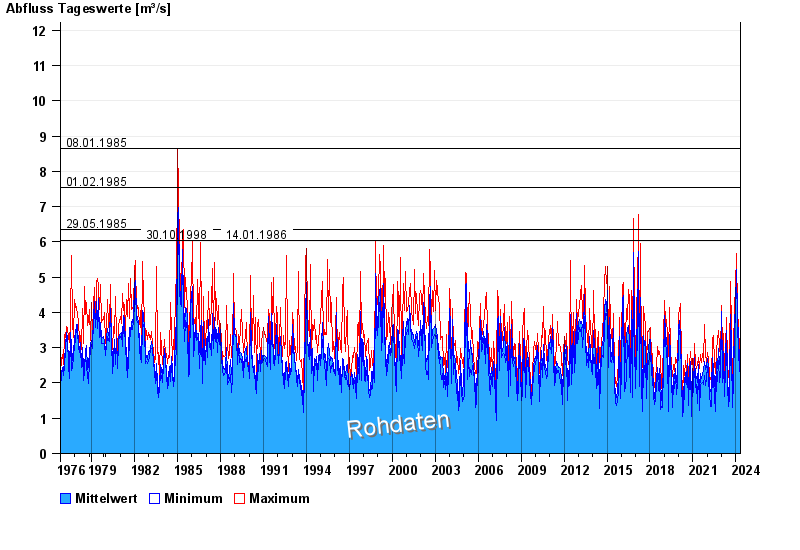
- 08.01.1985 Abfluss: 8,66 m³/s
- 01.02.1985 Abfluss: 7,54 m³/s
- 29.05.1985 Abfluss: 6,35 m³/s
- 30.10.1998 Abfluss: 6,03 m³/s
- 14.01.1986 Abfluss: 6,03 m³/s
| Date | Mean value [m³/s] | Maximum [m³/s] | Minimum [m³/s] |
|---|---|---|---|
| 27.04.2024 | 1.87 | 2.07 | 1.56 |
| 26.04.2024 | 1.97 | 1.99 | 1.85 |
| 25.04.2024 | 2.09 | 2.41 | 1.7 |
| 24.04.2024 | 2.42 | 2.59 | 2.32 |
| 23.04.2024 | 2.5 | 2.78 | 2.32 |
| 22.04.2024 | 2.83 | 3.3 | 2.5 |
| 21.04.2024 | 2.67 | 3.19 | 2.5 |
© Bayerisches Landesamt für Umwelt 2024