
- Start >
- Rivers >
- Discharge >
- Inn >
- Großschwindau >
- Chart of year

Chart of year Großschwindau / Goldach
Discharge from 04.08.2022 to 03.08.2023
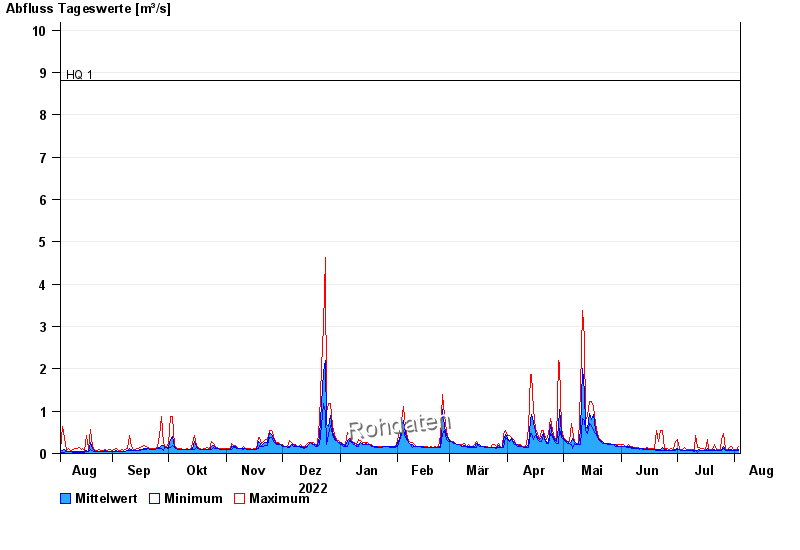
- HQ1 8,8 m³/s
- HQ2 11 m³/s
- HQ5 15 m³/s
- HQ10 19 m³/s
- HQ20 22 m³/s
- HQ50 26 m³/s
- HQ100 29 m³/s
| Date | Mean value [m³/s] | Maximum [m³/s] | Minimum [m³/s] |
|---|---|---|---|
| 03.08.2023 | 0.096 | 0.172 | 0.062 |
| 02.08.2023 | 0.069 | 0.084 | 0.062 |
| 01.08.2023 | 0.074 | 0.084 | 0.062 |
| 31.07.2023 | 0.067 | 0.084 | 0.062 |
| 30.07.2023 | 0.093 | 0.172 | 0.062 |
| 29.07.2023 | 0.086 | 0.14 | 0.062 |
| 28.07.2023 | 0.068 | 0.084 | 0.062 |
© Bayerisches Landesamt für Umwelt 2024