
- Start >
- Rivers >
- Discharge >
- Inn >
- Großschwindau >
- Chart of year

Chart of year Großschwindau / Goldach
Discharge from 04.08.2021 to 03.08.2022
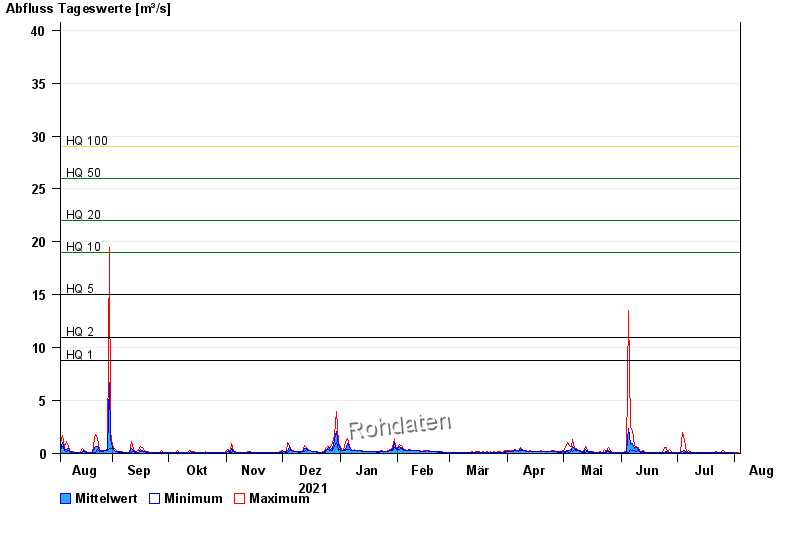
- HQ1 8,8 m³/s
- HQ2 11 m³/s
- HQ5 15 m³/s
- HQ10 19 m³/s
- HQ20 22 m³/s
- HQ50 26 m³/s
- HQ100 29 m³/s
| Date | Mean value [m³/s] | Maximum [m³/s] | Minimum [m³/s] |
|---|---|---|---|
| 03.08.2022 | 0.046 | 0.063 | 0.032 |
| 02.08.2022 | 0.047 | 0.107 | 0.046 |
| 01.08.2022 | 0.047 | 0.063 | 0.046 |
| 31.07.2022 | 0.064 | 0.135 | 0.046 |
| 30.07.2022 | 0.051 | 0.063 | 0.046 |
| 29.07.2022 | 0.055 | 0.135 | 0.046 |
| 28.07.2022 | 0.052 | 0.107 | 0.046 |
© Bayerisches Landesamt für Umwelt 2024