
- Start >
- Rivers >
- Discharge >
- Inn >
- Burghausen >
- Chart of year

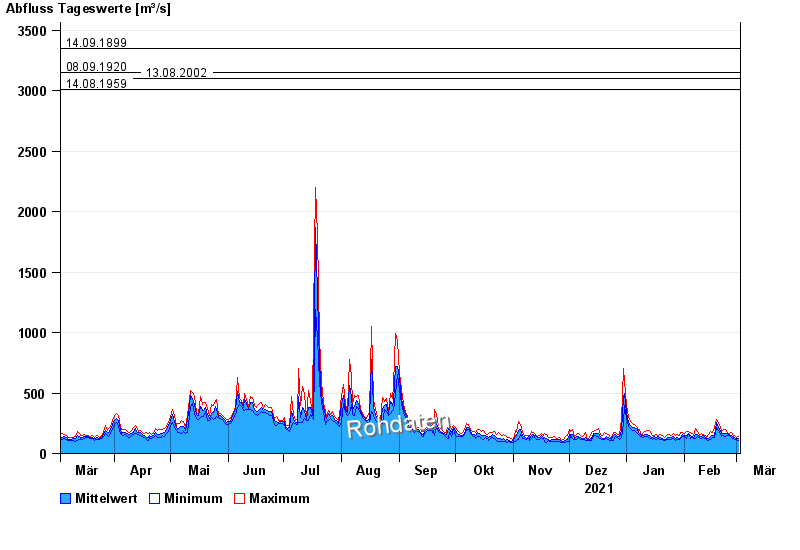
Chart of year Burghausen / Salzach
Discharge from 03.03.2021 to 02.03.2022
- 03.06.2013 Abfluss: 4000 m³/s
- 14.09.1899 Abfluss: 3350 m³/s
- 08.09.1920 Abfluss: 3150 m³/s
- 13.08.2002 Abfluss: 3100 m³/s
- 14.08.1959 Abfluss: 3010 m³/s
| Date | Mean value [m³/s] | Maximum [m³/s] | Minimum [m³/s] |
|---|---|---|---|
| 02.03.2022 | 123 | 140 | 110 |
| 01.03.2022 | 120 | 132 | 115 |
| 28.02.2022 | 131 | 145 | 116 |
| 27.02.2022 | 130 | 142 | 122 |
| 26.02.2022 | 148 | 172 | 131 |
| 25.02.2022 | 160 | 166 | 147 |
| 24.02.2022 | 162 | 177 | 148 |
© Bayerisches Landesamt für Umwelt 2024