
- Start >
- Rivers >
- Discharge >
- Inn >
- Burghausen >
- Chart of year

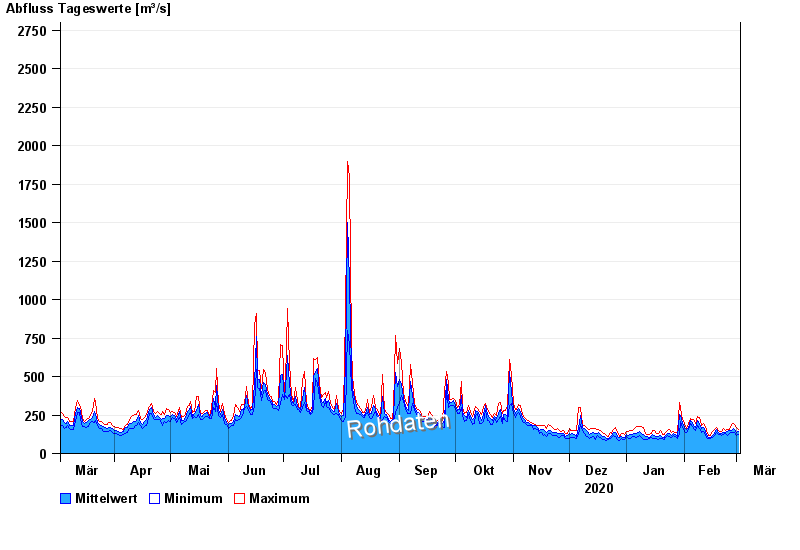
Chart of year Burghausen / Salzach
Discharge from 03.03.2020 to 02.03.2021
- 03.06.2013 Abfluss: 4000 m³/s
- 14.09.1899 Abfluss: 3350 m³/s
- 08.09.1920 Abfluss: 3150 m³/s
- 13.08.2002 Abfluss: 3100 m³/s
- 14.08.1959 Abfluss: 3010 m³/s
| Date | Mean value [m³/s] | Maximum [m³/s] | Minimum [m³/s] |
|---|---|---|---|
| 02.03.2021 | 141 | 155 | 125 |
| 01.03.2021 | 137 | 167 | 116 |
| 28.02.2021 | 156 | 186 | 138 |
| 27.02.2021 | 163 | 195 | 139 |
| 26.02.2021 | 151 | 190 | 139 |
| 25.02.2021 | 149 | 158 | 133 |
| 24.02.2021 | 140 | 157 | 120 |
© Bayerisches Landesamt für Umwelt 2024