
- Start >
- Rivers >
- Discharge >
- Inn >
- Bruckhäuser >
- Chart of year

Chart of year Bruckhäuser / Kollbach
Discharge from 01.01.2024 to 29.04.2024
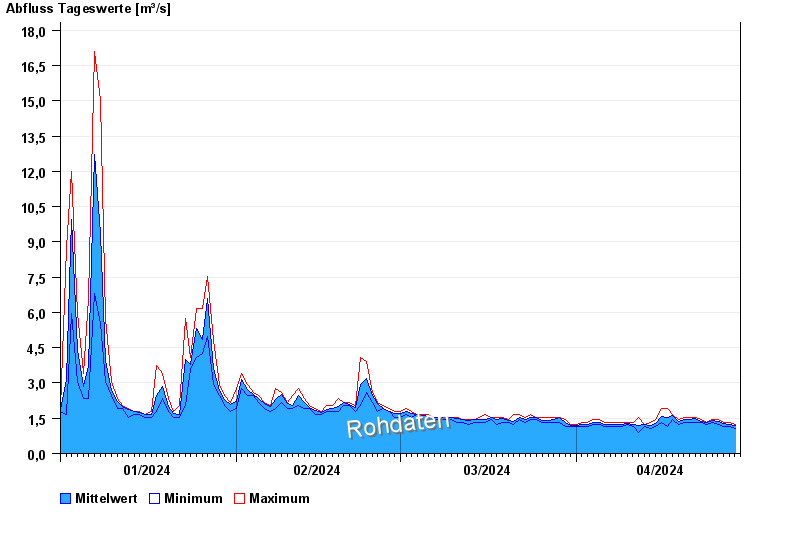
| Date | Mean value [m³/s] | Maximum [m³/s] | Minimum [m³/s] |
|---|---|---|---|
| 29.04.2024 | 1.23 | 1.23 | 1.05 |
| 28.04.2024 | 1.22 | 1.32 | 1.13 |
| 27.04.2024 | 1.27 | 1.32 | 1.13 |
| 26.04.2024 | 1.35 | 1.43 | 1.23 |
| 25.04.2024 | 1.41 | 1.43 | 1.32 |
| 24.04.2024 | 1.32 | 1.32 | 1.23 |
| 23.04.2024 | 1.37 | 1.43 | 1.32 |
© Bayerisches Landesamt für Umwelt 2024