
- Start >
- Rivers >
- Discharge >
- Inn >
- Bruckhäuser >
- Chart of year

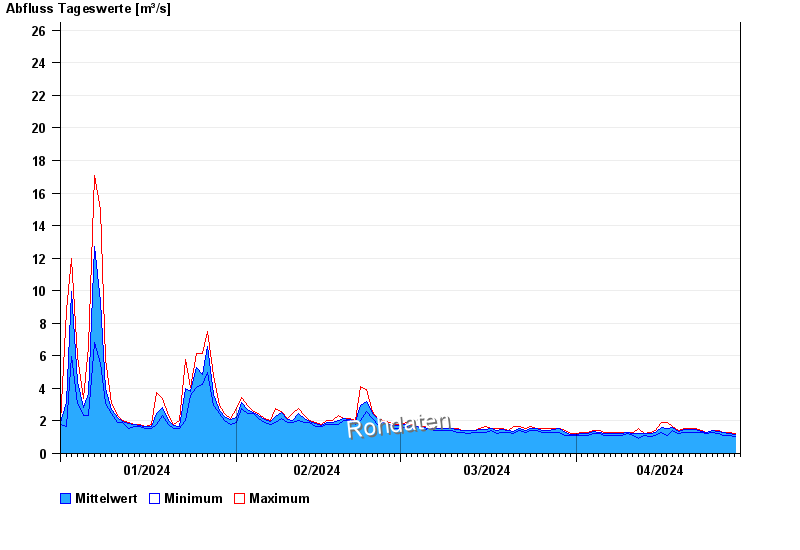
Chart of year Bruckhäuser / Kollbach
Discharge from 01.01.2024 to 29.04.2024
- 13.01.2011 Abfluss: 134 m³/s
- 14.01.2004 Abfluss: 124 m³/s
- 12.02.2005 Abfluss: 86,3 m³/s
- 02.06.2013 Abfluss: 74,2 m³/s
- 11.11.2002 Abfluss: 71,7 m³/s
| Date | Mean value [m³/s] | Maximum [m³/s] | Minimum [m³/s] |
|---|---|---|---|
| 29.04.2024 | 1.21 | 1.23 | 0.97 |
| 28.04.2024 | 1.22 | 1.32 | 1.13 |
| 27.04.2024 | 1.27 | 1.32 | 1.13 |
| 26.04.2024 | 1.35 | 1.43 | 1.23 |
| 25.04.2024 | 1.41 | 1.43 | 1.32 |
| 24.04.2024 | 1.32 | 1.32 | 1.23 |
| 23.04.2024 | 1.37 | 1.43 | 1.32 |
© Bayerisches Landesamt für Umwelt 2024