
- Start >
- Rivers >
- Discharge >
- Iller - Lech - Bodensee >
- Stielings >
- Chart of year

Chart of year Stielings / Leubas
Discharge from 27.09.2022 to 26.09.2023
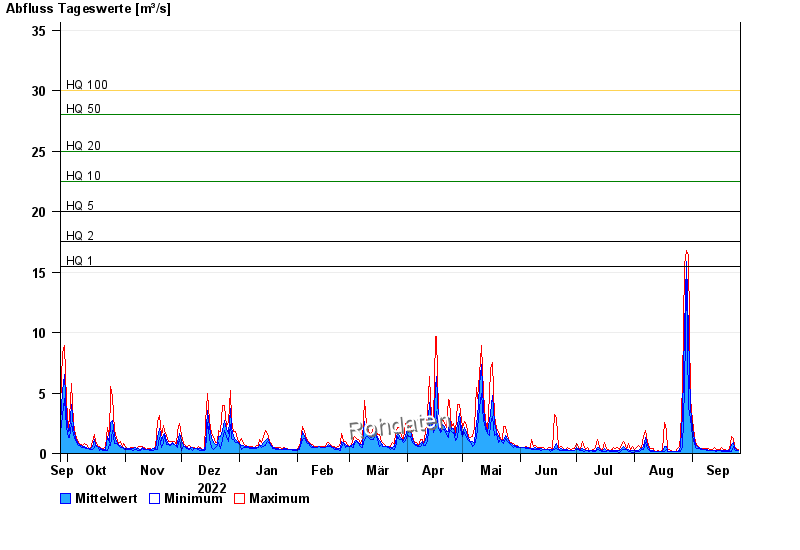
- HQ1 15,5 m³/s
- HQ2 17,5 m³/s
- HQ5 20 m³/s
- HQ10 22,5 m³/s
- HQ20 25 m³/s
- HQ50 28 m³/s
- HQ100 30 m³/s
| Date | Mean value [m³/s] | Maximum [m³/s] | Minimum [m³/s] |
|---|---|---|---|
| 26.09.2023 | 0.28 | 0.341 | 0.254 |
| 25.09.2023 | 0.322 | 0.395 | 0.254 |
| 24.09.2023 | 0.464 | 0.604 | 0.341 |
| 23.09.2023 | 0.936 | 1.25 | 0.604 |
| 22.09.2023 | 0.718 | 1.38 | 0.19 |
| 21.09.2023 | 0.213 | 0.341 | 0.163 |
| 20.09.2023 | 0.207 | 0.254 | 0.163 |
© Bayerisches Landesamt für Umwelt 2024