
- Start >
- Rivers >
- Discharge >
- Iller - Lech - Bodensee >
- Stielings >
- Chart of year

Chart of year Stielings / Leubas
Discharge from 27.09.2021 to 26.09.2022
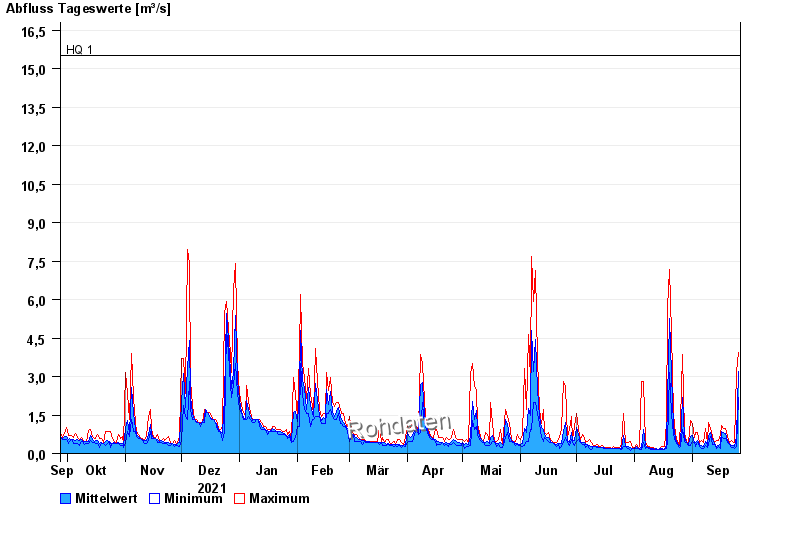
- HQ1 15,5 m³/s
- HQ2 17,5 m³/s
- HQ5 20 m³/s
- HQ10 22,5 m³/s
- HQ20 25 m³/s
- HQ50 28 m³/s
- HQ100 30 m³/s
| Date | Mean value [m³/s] | Maximum [m³/s] | Minimum [m³/s] |
|---|---|---|---|
| 26.09.2022 | 3.21 | 3.92 | 2.17 |
| 25.09.2022 | 0.67 | 3.18 | 0.264 |
| 24.09.2022 | 0.277 | 0.421 | 0.193 |
| 23.09.2022 | 0.298 | 0.421 | 0.225 |
| 22.09.2022 | 0.324 | 0.489 | 0.225 |
| 21.09.2022 | 0.395 | 0.421 | 0.361 |
| 20.09.2022 | 0.518 | 0.652 | 0.421 |
© Bayerisches Landesamt für Umwelt 2024