
- Start >
- Rivers >
- Discharge >
- Iller - Lech - Bodensee >
- Lauben >
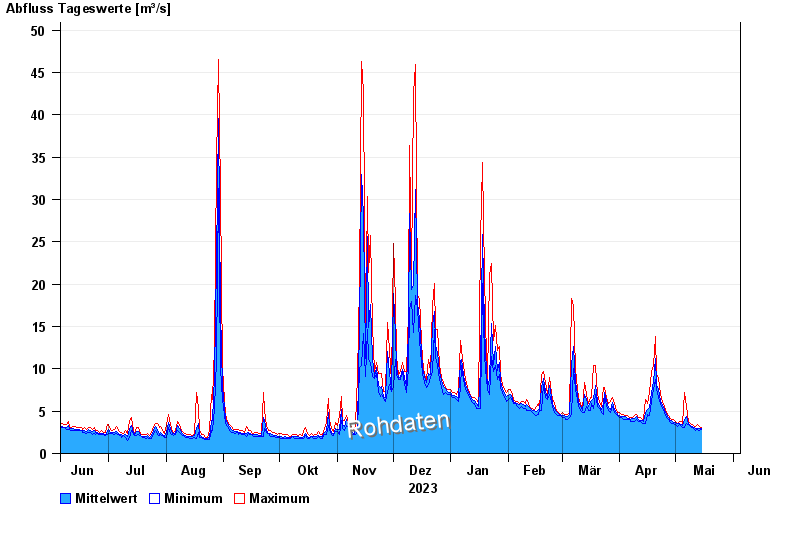
- Chart of year

Chart of year Lauben / Günz
Discharge from 05.06.2023 to 04.06.2024
| Date | Mean value [m³/s] | Maximum [m³/s] | Minimum [m³/s] |
|---|---|---|---|
| 30.05.2024 | 5.33 | 6.94 | 4.65 |
| 29.05.2024 | 5.49 | 6.67 | 4.65 |
| 28.05.2024 | 8.53 | 10.7 | 6.67 |
| 27.05.2024 | 5.71 | 10.4 | 4.21 |
| 26.05.2024 | 6.39 | 8.12 | 5.12 |
| 25.05.2024 | 17.9 | 33.4 | 8.12 |
| 24.05.2024 | 5.99 | 24.3 | 3.8 |
© Bayerisches Landesamt für Umwelt 2024