
- Start >
- Rivers >
- Discharge >
- Iller - Lech - Bodensee >
- Lauben >
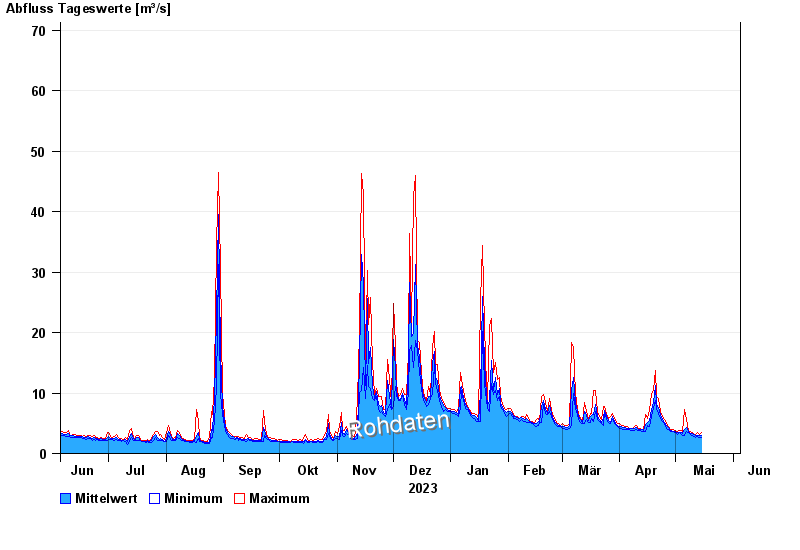
- Chart of year

Chart of year Lauben / Günz
Discharge from 05.06.2023 to 04.06.2024
- 31.05.1940 Abfluss: 90,8 m³/s
- 12.08.2002 Abfluss: 85,2 m³/s
- 18.06.1991 Abfluss: 83,4 m³/s
- 23.08.2005 Abfluss: 76,8 m³/s
- 13.04.1994 Abfluss: 74 m³/s
| Date | Mean value [m³/s] | Maximum [m³/s] | Minimum [m³/s] |
|---|---|---|---|
| 04.06.2024 | 26.9 | 37 | 21.4 |
| 03.06.2024 | 42 | 46.5 | 37.5 |
| 02.06.2024 | 54.2 | 72.1 | 39.7 |
| 01.06.2024 | 85.6 | 108 | 72.1 |
| 31.05.2024 | 34.5 | 77.9 | 12.6 |
| 30.05.2024 | 7.58 | 14.7 | 4.65 |
| 29.05.2024 | 5.49 | 6.67 | 4.65 |
© Bayerisches Landesamt für Umwelt 2024