
- Start >
- Rivers >
- Discharge >
- Iller - Lech - Bodensee >
- Gunzesried >
- Chart of total period

Chart of total period Gunzesried / Gunzesrieder Ach
Discharge from 01.11.1951 to 26.04.2024
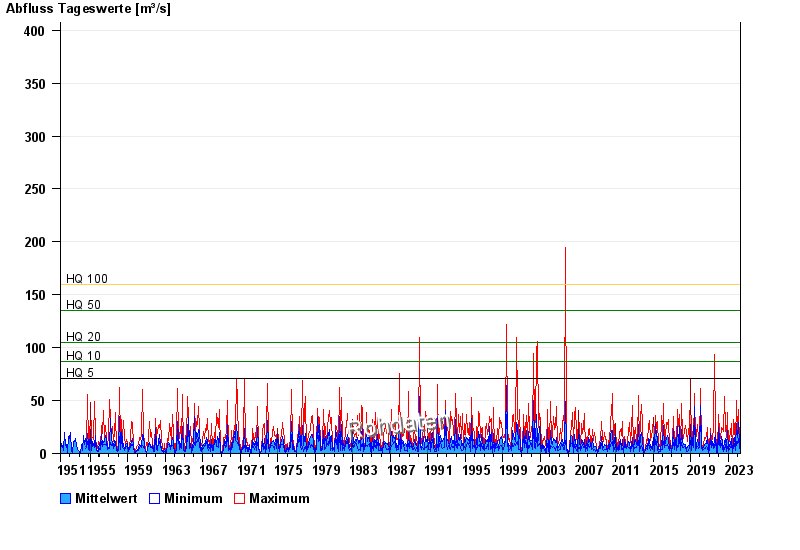
- HQ5 71 m³/s
- HQ10 87 m³/s
- HQ20 105 m³/s
- HQ50 135 m³/s
- HQ100 160 m³/s
| Date | Mean value [m³/s] | Maximum [m³/s] | Minimum [m³/s] |
|---|---|---|---|
| 26.04.2024 | 1.86 | 1.86 | 1.86 |
| 25.04.2024 | 1.72 | 1.86 | 1.62 |
| 24.04.2024 | 1.71 | 1.74 | 1.62 |
| 23.04.2024 | 1.75 | 1.86 | 1.74 |
| 22.04.2024 | 1.88 | 1.99 | 1.74 |
| 21.04.2024 | 2.1 | 2.26 | 1.99 |
| 20.04.2024 | 2.31 | 2.55 | 2.12 |
© Bayerisches Landesamt für Umwelt 2024