
- Start >
- Rivers >
- Discharge >
- Iller - Lech - Bodensee >
- Gunzesried >
- Chart of total period

Chart of total period Gunzesried / Gunzesrieder Ach
Discharge from 01.11.1951 to 19.04.2024
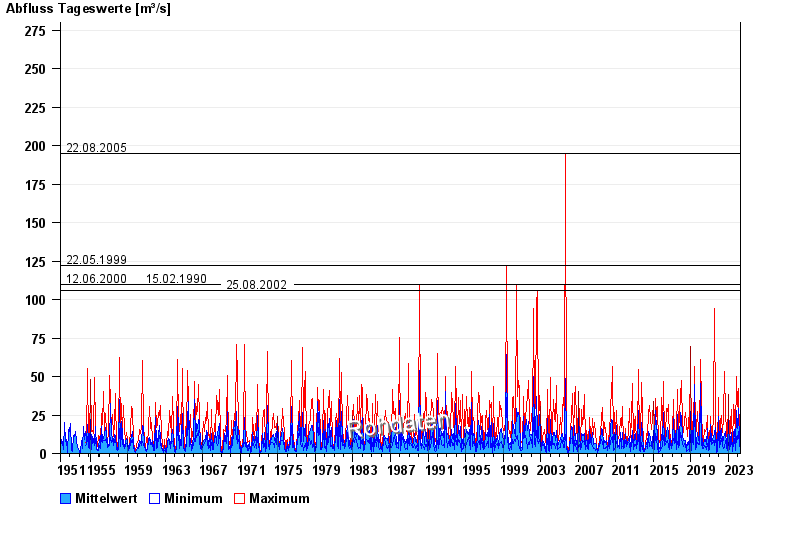
- 22.08.2005 Abfluss: 195 m³/s
- 22.05.1999 Abfluss: 122 m³/s
- 12.06.2000 Abfluss: 110 m³/s
- 15.02.1990 Abfluss: 110 m³/s
- 25.08.2002 Abfluss: 106 m³/s
| Date | Mean value [m³/s] | Maximum [m³/s] | Minimum [m³/s] |
|---|---|---|---|
| 19.04.2024 | 2.25 | 2.41 | 2.12 |
| 18.04.2024 | 2.39 | 2.55 | 2.26 |
| 17.04.2024 | 2.72 | 3 | 2.55 |
| 16.04.2024 | 3.59 | 5.52 | 2.85 |
| 15.04.2024 | 4.78 | 6.36 | 3.48 |
| 14.04.2024 | 4.03 | 5.72 | 3 |
| 13.04.2024 | 3.4 | 4.73 | 2.55 |
© Bayerisches Landesamt für Umwelt 2024