
- Start >
- Rivers >
- Discharge >
- Iller - Lech - Bodensee >
- Görisried >
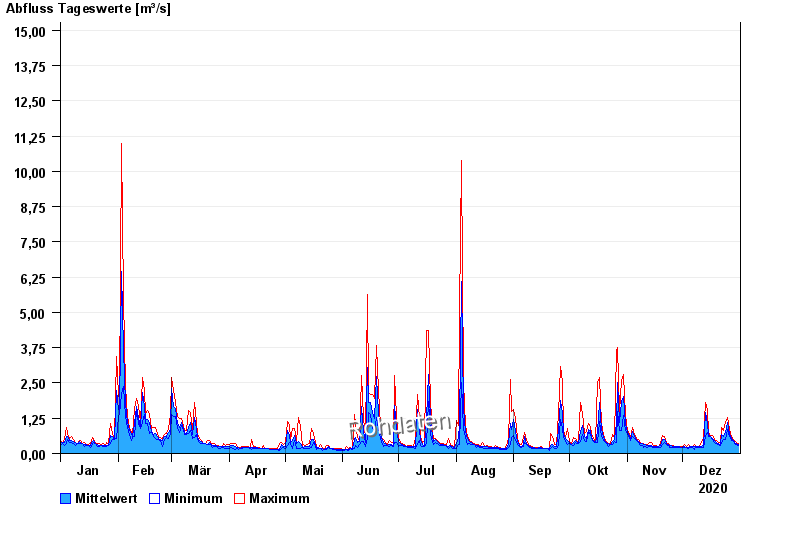
- Chart of year

Chart of year Görisried / Waldbach
Discharge from 01.01.2020 to 31.12.2020
- 21.06.1943 Abfluss: 120 m³/s
- 20.07.2007 Abfluss: 56,8 m³/s
- 15.07.2002 Abfluss: 45,3 m³/s
- 21.06.1953 Abfluss: 42,6 m³/s
- 18.03.1944 Abfluss: 41,7 m³/s
| Date | Mean value [m³/s] | Maximum [m³/s] | Minimum [m³/s] |
|---|---|---|---|
| 31.12.2020 | 0.333 | 0.363 | 0.288 |
| 30.12.2020 | 0.363 | 0.404 | 0.324 |
| 29.12.2020 | 0.396 | 0.447 | 0.363 |
| 28.12.2020 | 0.461 | 0.493 | 0.447 |
| 27.12.2020 | 0.517 | 0.588 | 0.447 |
| 26.12.2020 | 0.707 | 0.851 | 0.588 |
| 25.12.2020 | 1.09 | 1.29 | 0.851 |
© Bayerisches Landesamt für Umwelt 2024