
- Start >
- Rivers >
- Discharge >
- Iller - Lech - Bodensee >
- Görisried >
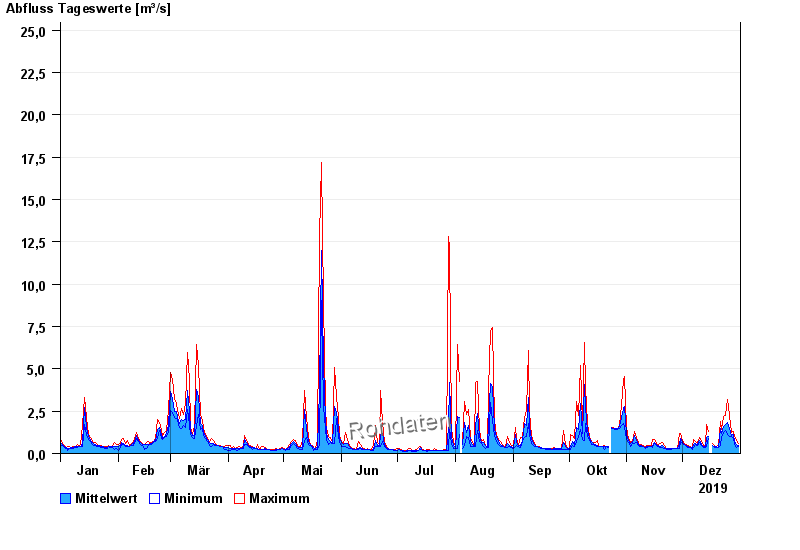
- Chart of year

Chart of year Görisried / Waldbach
Discharge from 01.01.2019 to 31.12.2019
- 21.06.1943 Abfluss: 120 m³/s
- 20.07.2007 Abfluss: 56,8 m³/s
- 15.07.2002 Abfluss: 45,3 m³/s
- 21.06.1953 Abfluss: 42,6 m³/s
- 18.03.1944 Abfluss: 41,7 m³/s
| Date | Mean value [m³/s] | Maximum [m³/s] | Minimum [m³/s] |
|---|---|---|---|
| 31.12.2019 | 0.495 | 0.611 | 0.406 |
| 30.12.2019 | 0.559 | 0.761 | 0.371 |
| 29.12.2019 | 0.732 | 0.989 | 0.522 |
| 28.12.2019 | 1.11 | 1.31 | 0.871 |
| 27.12.2019 | 1.06 | 1.24 | 0.989 |
| 26.12.2019 | 1.49 | 2.24 | 0.989 |
| 25.12.2019 | 1.81 | 3.2 | 1.11 |
© Bayerisches Landesamt für Umwelt 2024