
- Start >
- Rivers >
- Discharge >
- Oberer Main - Elbe >
- Unterleinleiter >
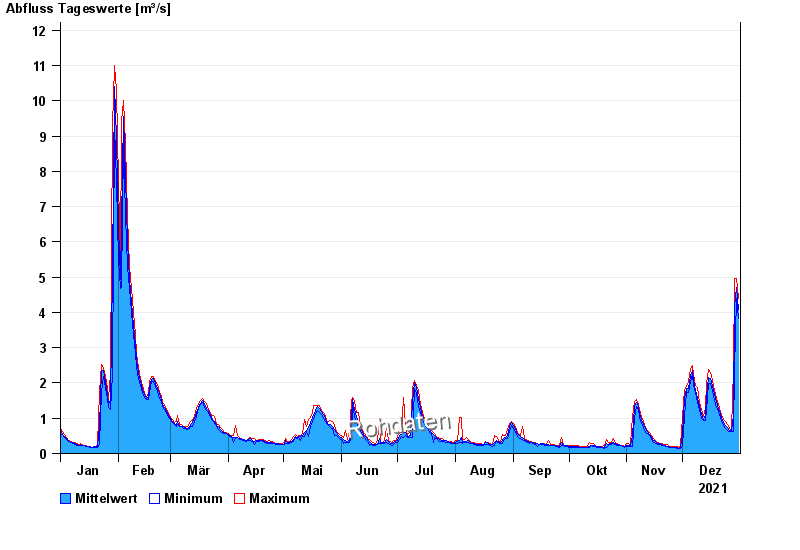
- Chart of year

Chart of year Unterleinleiter / Leinleiterbach
Discharge from 01.01.2021 to 31.12.2021
| Date | Mean value [m³/s] | Maximum [m³/s] | Minimum [m³/s] |
|---|---|---|---|
| 31.12.2021 | 4.09 | 4.38 | 3.82 |
| 30.12.2021 | 4.71 | 4.97 | 4.38 |
| 29.12.2021 | 4.18 | 4.97 | 2.38 |
| 28.12.2021 | 1.08 | 2.38 | 0.631 |
| 27.12.2021 | 0.656 | 0.679 | 0.625 |
| 26.12.2021 | 0.657 | 0.718 | 0.622 |
| 25.12.2021 | 0.724 | 0.817 | 0.663 |
© Bayerisches Landesamt für Umwelt 2024