
- Start >
- Rivers >
- Discharge >
- Oberer Main - Elbe >
- Unterleinleiter >
- Chart of year

Chart of year Unterleinleiter / Leinleiterbach
Discharge from 01.01.2020 to 31.12.2020
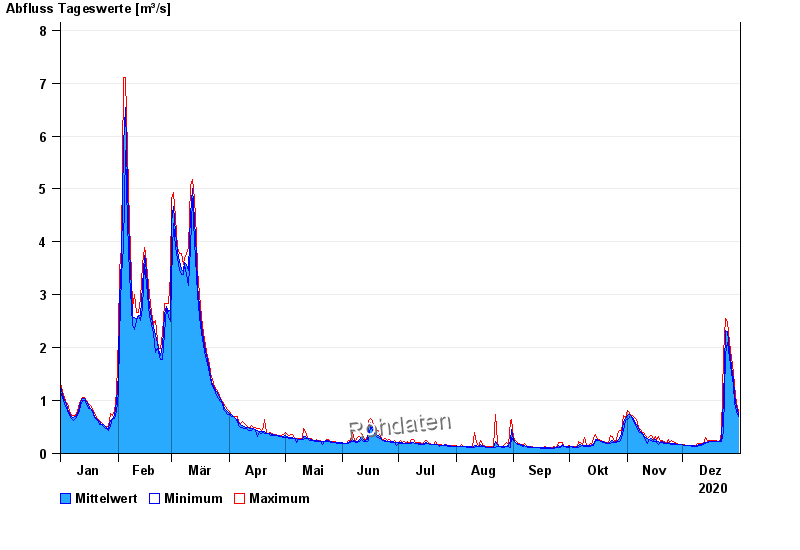
| Date | Mean value [m³/s] | Maximum [m³/s] | Minimum [m³/s] |
|---|---|---|---|
| 31.12.2020 | 0.745 | 0.799 | 0.704 |
| 30.12.2020 | 0.888 | 0.952 | 0.799 |
| 29.12.2020 | 1.1 | 1.29 | 0.952 |
| 28.12.2020 | 1.4 | 1.54 | 1.29 |
| 27.12.2020 | 1.65 | 1.81 | 1.54 |
| 26.12.2020 | 1.94 | 2.09 | 1.81 |
| 25.12.2020 | 2.3 | 2.48 | 2.09 |
© Bayerisches Landesamt für Umwelt 2024