
- Start >
- Rivers >
- Discharge >
- Oberer Main - Elbe >
- Unterlangenstadt >
- Chart of year

Chart of year Unterlangenstadt / Rodach
Discharge from 30.03.2024 to 29.03.2025
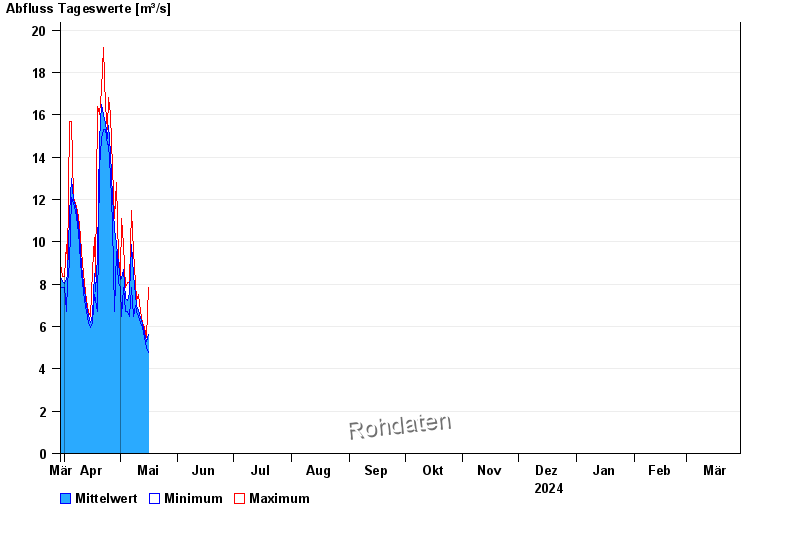
| Date | Mean value [m³/s] | Maximum [m³/s] | Minimum [m³/s] |
|---|---|---|---|
| 29.04.2024 | 10.1 | 12.8 | 9.53 |
| 28.04.2024 | 10.6 | 11.1 | 6.72 |
| 27.04.2024 | 12.1 | 13.5 | 10.8 |
| 26.04.2024 | 14.2 | 16 | 13.1 |
| 25.04.2024 | 15.5 | 16.8 | 14.6 |
| 24.04.2024 | 14.9 | 15.3 | 14.6 |
| 23.04.2024 | 15.6 | 16.4 | 15.3 |
© Bayerisches Landesamt für Umwelt 2024