
- Start >
- Rivers >
- Discharge >
- Oberer Main - Elbe >
- Unterlangenstadt >
- Chart of year

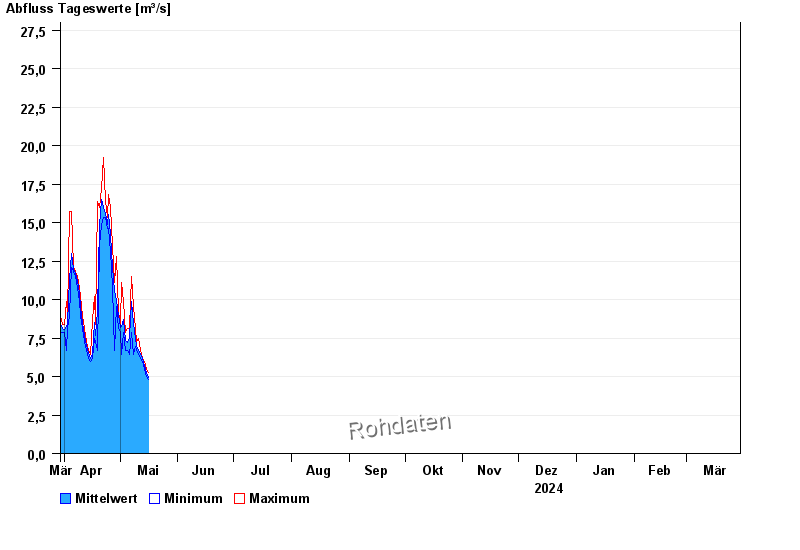
Chart of year Unterlangenstadt / Rodach
Discharge from 30.03.2024 to 29.03.2025
- 09.02.1946 Abfluss: 344 m³/s
- 24.12.1967 Abfluss: 342 m³/s
- 28.12.1947 Abfluss: 316 m³/s
- 05.11.1940 Abfluss: 302 m³/s
- 14.01.1948 Abfluss: 266 m³/s
| Date | Mean value [m³/s] | Maximum [m³/s] | Minimum [m³/s] |
|---|---|---|---|
| 16.05.2024 | 4.96 | 5.23 | 4.78 |
| 15.05.2024 | 5.27 | 5.47 | 5.01 |
| 14.05.2024 | 5.7 | 5.95 | 5.47 |
| 13.05.2024 | 6.15 | 6.2 | 5.95 |
| 12.05.2024 | 6.41 | 6.72 | 6.2 |
| 11.05.2024 | 6.77 | 7.49 | 6.46 |
| 10.05.2024 | 6.98 | 7.25 | 6.72 |
© Bayerisches Landesamt für Umwelt 2024