
- Start >
- Rivers >
- Discharge >
- Oberer Main - Elbe >
- Trebgast >
- Chart of year

Chart of year Trebgast / Trebgast
Discharge from 04.12.2022 to 03.12.2023
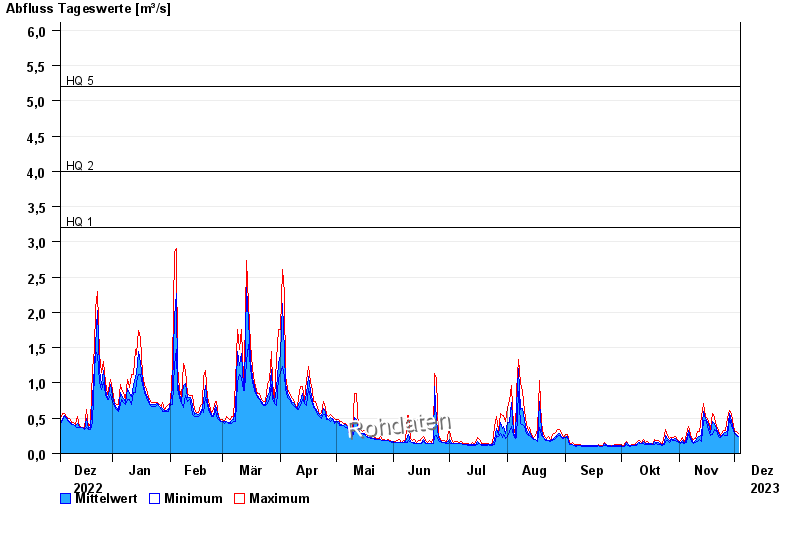
- HQ1 3,2 m³/s
- HQ2 4 m³/s
- HQ5 5,2 m³/s
- HQ10 6,2 m³/s
- HQ20 7,1 m³/s
- HQ50 8,4 m³/s
- HQ100 10 m³/s
| Date | Mean value [m³/s] | Maximum [m³/s] | Minimum [m³/s] |
|---|---|---|---|
| 03.12.2023 | 0.245 | 0.289 | 0.241 |
| 02.12.2023 | 0.274 | 0.307 | 0.256 |
| 01.12.2023 | 0.303 | 0.324 | 0.289 |
| 30.11.2023 | 0.339 | 0.396 | 0.324 |
| 29.11.2023 | 0.449 | 0.551 | 0.378 |
| 28.11.2023 | 0.566 | 0.615 | 0.491 |
| 27.11.2023 | 0.33 | 0.491 | 0.256 |
© Bayerisches Landesamt für Umwelt 2024