
- Start >
- Rivers >
- Discharge >
- Oberer Main - Elbe >
- Trebgast >
- Chart of year

Chart of year Trebgast / Trebgast
Discharge from 04.12.2021 to 03.12.2022
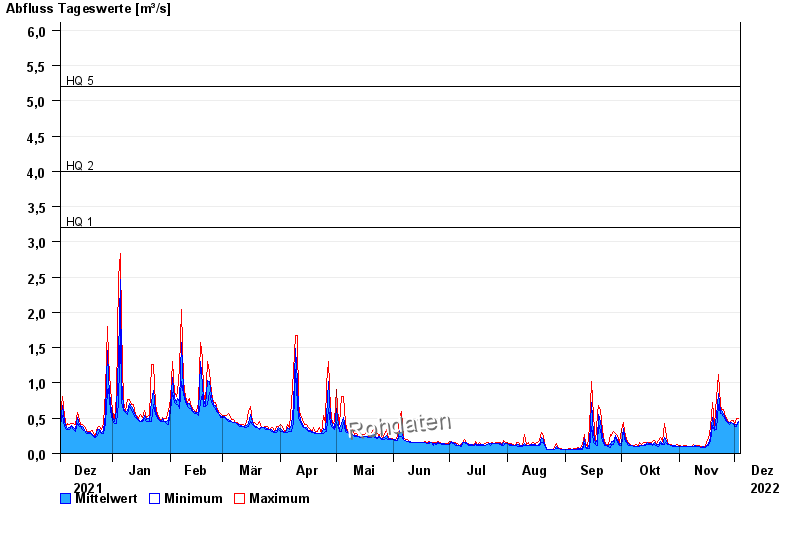
- HQ1 3,2 m³/s
- HQ2 4 m³/s
- HQ5 5,2 m³/s
- HQ10 6,2 m³/s
- HQ20 7,1 m³/s
- HQ50 8,4 m³/s
- HQ100 10 m³/s
| Date | Mean value [m³/s] | Maximum [m³/s] | Minimum [m³/s] |
|---|---|---|---|
| 03.12.2022 | 0.456 | 0.496 | 0.437 |
| 02.12.2022 | 0.413 | 0.496 | 0.387 |
| 01.12.2022 | 0.393 | 0.412 | 0.387 |
| 30.11.2022 | 0.429 | 0.463 | 0.412 |
| 29.11.2022 | 0.442 | 0.463 | 0.437 |
| 28.11.2022 | 0.436 | 0.437 | 0.412 |
| 27.11.2022 | 0.45 | 0.463 | 0.437 |
© Bayerisches Landesamt für Umwelt 2024