
- Start >
- Rivers >
- Discharge >
- Oberer Main - Elbe >
- Oberlauter >
- Chart of year

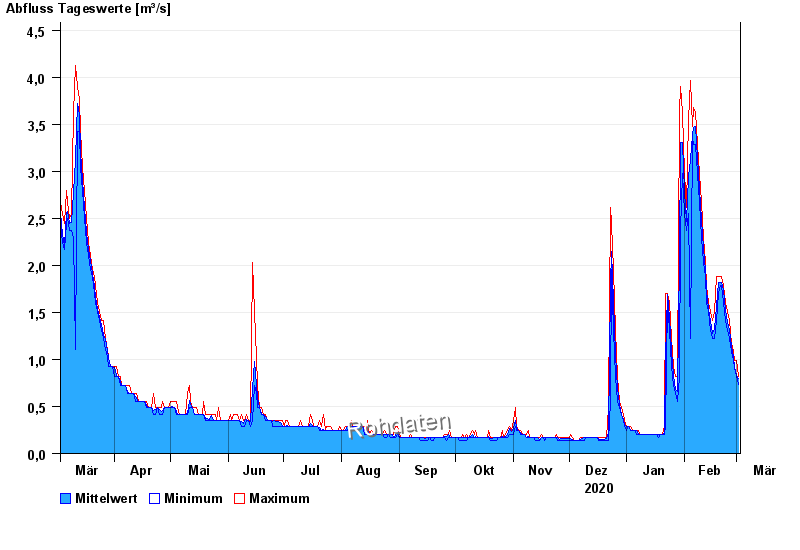
Chart of year Oberlauter / Lauterbach
Discharge from 03.03.2020 to 02.03.2021
| Date | Mean value [m³/s] | Maximum [m³/s] | Minimum [m³/s] |
|---|---|---|---|
| 02.03.2021 | 0.792 | 0.816 | 0.732 |
| 01.03.2021 | 0.834 | 0.991 | 0.816 |
| 28.02.2021 | 0.916 | 0.991 | 0.902 |
| 27.02.2021 | 1.03 | 1.08 | 0.991 |
| 26.02.2021 | 1.14 | 1.17 | 1.08 |
| 25.02.2021 | 1.32 | 1.41 | 1.22 |
| 24.02.2021 | 1.39 | 1.51 | 1.31 |
© Bayerisches Landesamt für Umwelt 2024