
- Start >
- Rivers >
- Discharge >
- Oberer Main - Elbe >
- Oberlauter >
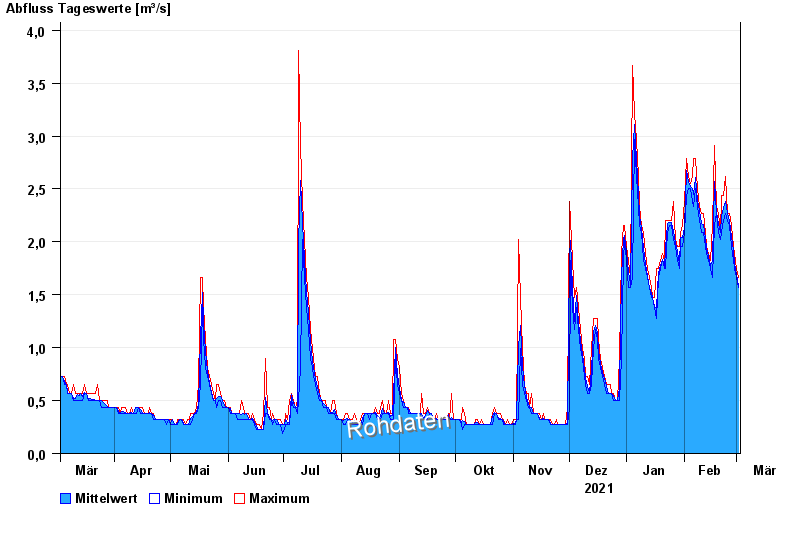
- Chart of year

Chart of year Oberlauter / Lauterbach
Discharge from 03.03.2021 to 02.03.2022
| Date | Mean value [m³/s] | Maximum [m³/s] | Minimum [m³/s] |
|---|---|---|---|
| 02.03.2022 | 1.59 | 1.66 | 1.57 |
| 01.03.2022 | 1.69 | 1.75 | 1.66 |
| 28.02.2022 | 1.8 | 1.89 | 1.75 |
| 27.02.2022 | 1.92 | 1.96 | 1.82 |
| 26.02.2022 | 2.05 | 2.15 | 1.96 |
| 25.02.2022 | 2.19 | 2.27 | 2.15 |
| 24.02.2022 | 2.27 | 2.27 | 2.2 |
© Bayerisches Landesamt für Umwelt 2024