
- Start >
- Rivers >
- Discharge >
- Oberer Main - Elbe >
- Neukenroth >
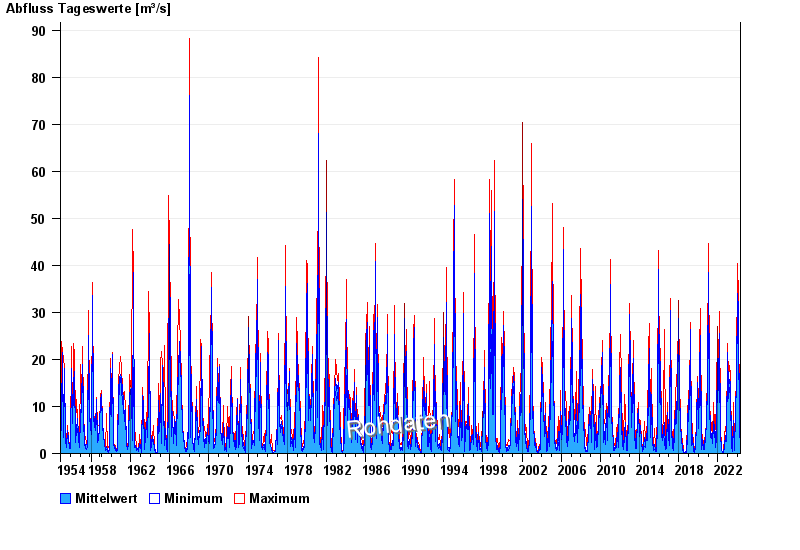
- Chart of total period

Chart of total period Neukenroth / Haßlach
Discharge from 01.11.1954 to 26.04.2024
| Date | Mean value [m³/s] | Maximum [m³/s] | Minimum [m³/s] |
|---|---|---|---|
| 26.04.2024 | 3.51 | 3.56 | 3.47 |
| 25.04.2024 | 3.57 | 3.74 | 3.39 |
| 24.04.2024 | 3.35 | 3.56 | 3.22 |
| 23.04.2024 | 3.52 | 3.66 | 3.39 |
| 22.04.2024 | 3.64 | 3.66 | 3.56 |
| 21.04.2024 | 3.66 | 3.66 | 3.66 |
| 20.04.2024 | 3.41 | 3.66 | 3.13 |
© Bayerisches Landesamt für Umwelt 2024