
- Start >
- Rivers >
- Discharge >
- Oberer Main - Elbe >
- Neukenroth >
- Chart of total period

Chart of total period Neukenroth / Haßlach
Discharge from 01.11.1954 to 25.04.2024
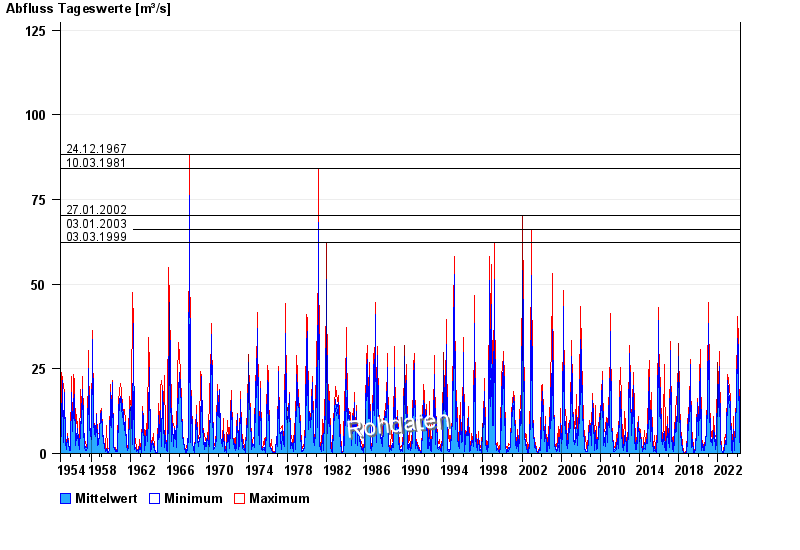
- 24.12.1967 Abfluss: 88,2 m³/s
- 10.03.1981 Abfluss: 84,1 m³/s
- 27.01.2002 Abfluss: 70,3 m³/s
- 03.01.2003 Abfluss: 66 m³/s
- 03.03.1999 Abfluss: 62,2 m³/s
| Date | Mean value [m³/s] | Maximum [m³/s] | Minimum [m³/s] |
|---|---|---|---|
| 25.04.2024 | 3.53 | 3.66 | 3.39 |
| 24.04.2024 | 3.35 | 3.56 | 3.22 |
| 23.04.2024 | 3.52 | 3.66 | 3.39 |
| 22.04.2024 | 3.64 | 3.66 | 3.56 |
| 21.04.2024 | 3.66 | 3.66 | 3.66 |
| 20.04.2024 | 3.41 | 3.66 | 3.13 |
| 19.04.2024 | 2.34 | 4.14 | 1.36 |
© Bayerisches Landesamt für Umwelt 2024