
- Start >
- Rivers >
- Discharge >
- Oberer Main - Elbe >
- Muggendorf >
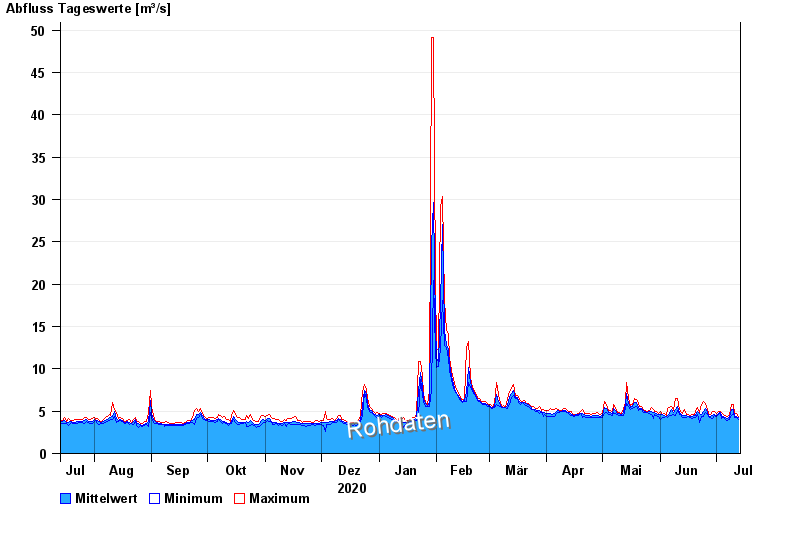
- Chart of year

Chart of year Muggendorf / Wiesent
Discharge from 14.07.2020 to 13.07.2021
| Date | Mean value [m³/s] | Maximum [m³/s] | Minimum [m³/s] |
|---|---|---|---|
| 13.07.2021 | 4.26 | 4.41 | 4 |
| 12.07.2021 | 4.36 | 4.69 | 4.27 |
| 11.07.2021 | 4.41 | 4.71 | 4.28 |
| 10.07.2021 | 5.24 | 5.8 | 4.71 |
| 09.07.2021 | 5.22 | 5.8 | 4.44 |
| 08.07.2021 | 4.21 | 4.58 | 4.04 |
| 07.07.2021 | 4.14 | 4.32 | 3.92 |
© Bayerisches Landesamt für Umwelt 2024