
- Start >
- Rivers >
- Discharge >
- Oberer Main - Elbe >
- Muggendorf >
- Chart of year

Chart of year Muggendorf / Wiesent
Discharge from 14.07.2019 to 13.07.2020
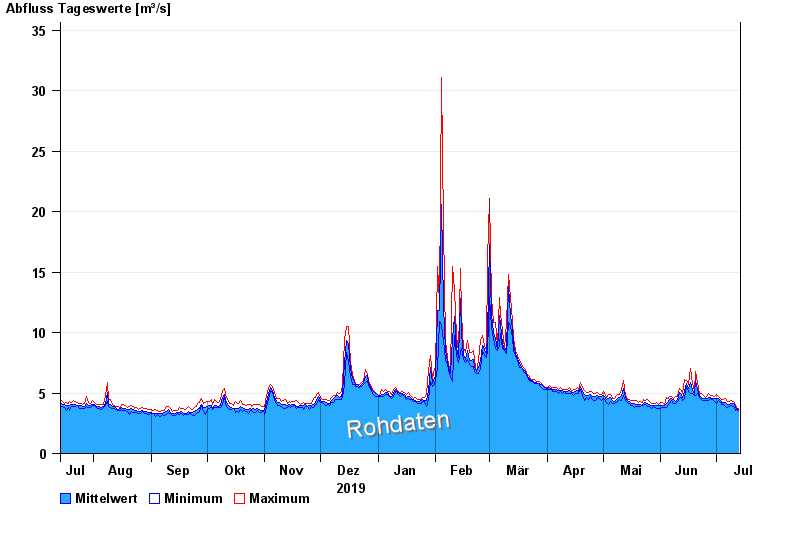
| Date | Mean value [m³/s] | Maximum [m³/s] | Minimum [m³/s] |
|---|---|---|---|
| 13.07.2020 | 3.66 | 3.73 | 3.5 |
| 12.07.2020 | 3.7 | 3.8 | 3.64 |
| 11.07.2020 | 3.83 | 4.01 | 3.57 |
| 10.07.2020 | 4.11 | 4.32 | 3.92 |
| 09.07.2020 | 4.16 | 4.36 | 3.98 |
| 08.07.2020 | 4.04 | 4.29 | 3.9 |
| 07.07.2020 | 4.07 | 4.34 | 3.83 |
© Bayerisches Landesamt für Umwelt 2024